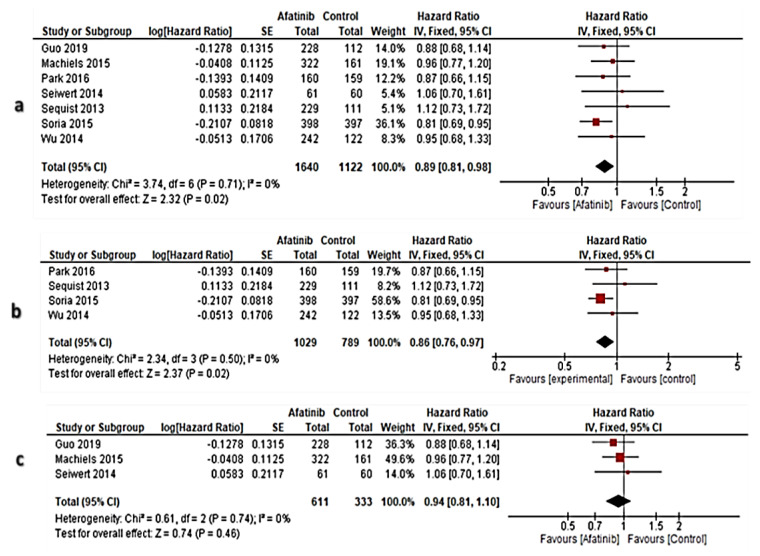
Figure 4.
Forest plots of OS; (a): Subset of OS in all RCTs, (b): The subset of OS in NSCLC, (c): subset of OS in HNSCC. Fixed effect model of meta-analysis has proceeded. Red color is the CenterPoint of the confidence interval expressing the weight of the sample size in each RCT, while black-colored diamond denoted the overall effect size.

