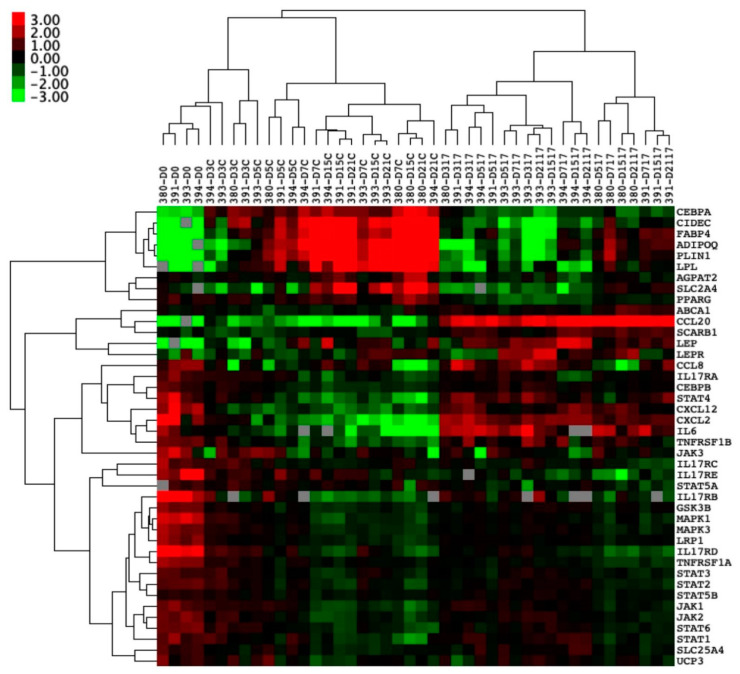
Figure 4.
Entheseal soft tissue (EST) mesenchymal stem cells (MSCs) (n = 4) undergoing 21-day adipogenesis ± IL-17A. Hierarchical clustering demonstrating the distinct clustering of unstimulated MSCs undergoing adipogenesis away from MSCs stimulated by IL-17A. Colour denotes the relative expression of Hypoxanthine Phosphoribosyltransferase 1 (HPRT1), with green representing low, black representing equal, red representing higher, and gray representing below detection. Numbers denote the sample ID, and D indicates the days in culture. IL-17A used at 50 ng/mL.

