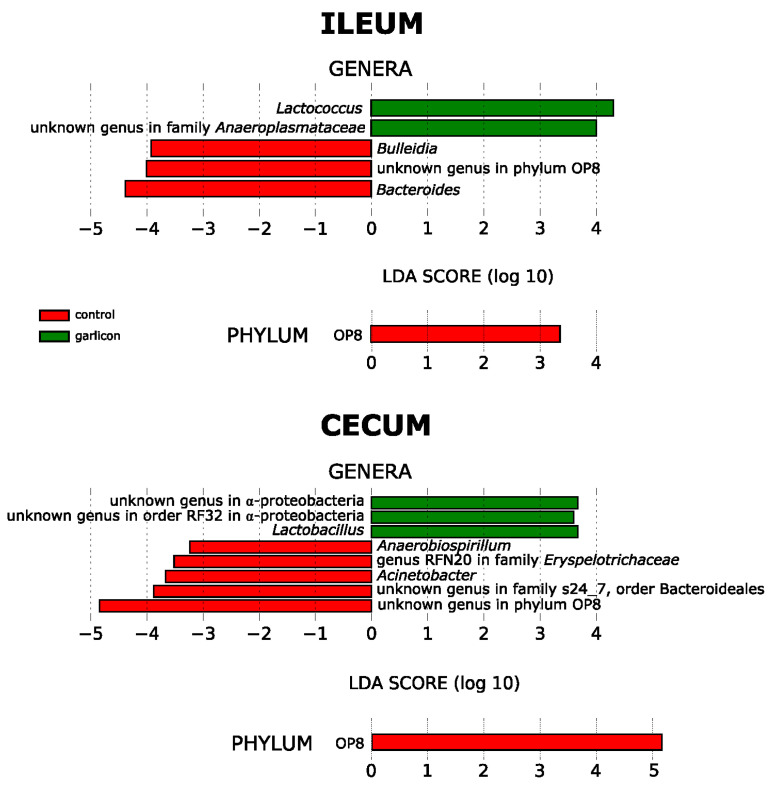
Figure 4.
Linear Discriminant Analysis Effect Size (LEfSe) analyses showing bacterial genera (outer circles in the trees) and phyla (inner circles in the tree) that differed significantly between control hens and those supplemented with a commercial Alliaceae extract, in the ileum and cecum. Green bars and dots indicate a significant increase in relative abundance in the supplemented groups while red bars and dots showed a significant decrease.

