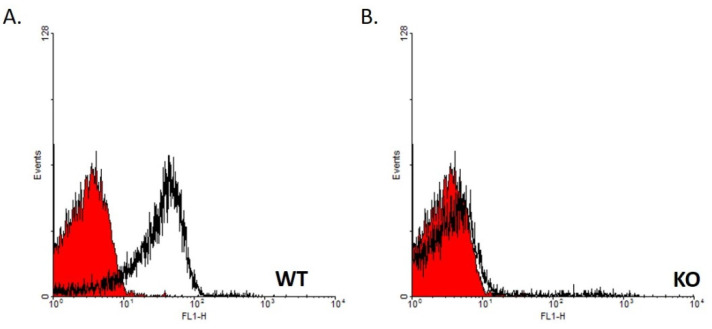
Figure 1.
The genotype of the mice was verified by FACS analysis, based on the absence of CD24 expression on the surface of erythrocytes from the KO mice. Heparinized peripheral blood samples of WT (A) and KO (B) mice were collected and analyzed for CD24 expression. The X-axis (FL1-H) represents florescence magnitude (to the fluorescein isothiocyanate-conjugated goat anti-rat antibody). The red curves represent the negative control (secondary antibody only), and the black curves represent the binding of M1/69 anti-CD24 antibody.

