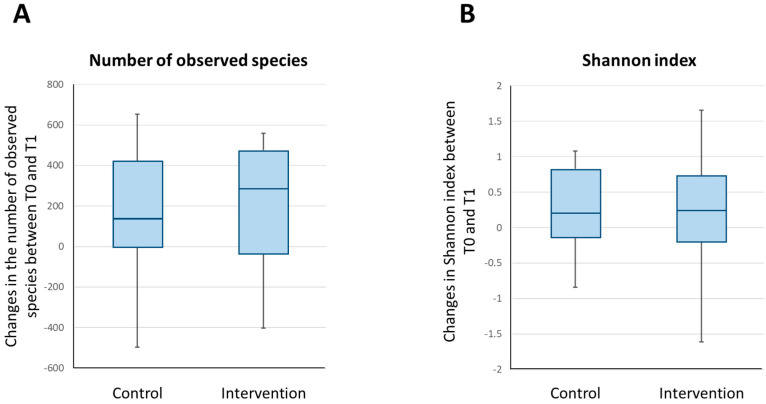
Figure 3.
Changes in the alpha diversity parameters of the intestinal microbiota of the participants between baseline and post-intervention. The box and whisker plots show the median, lower quartile, upper quartile, minimum value and maximum value of the number of observed species in the intestinal microbiota of the participants (A) and the Shannon index (B).

