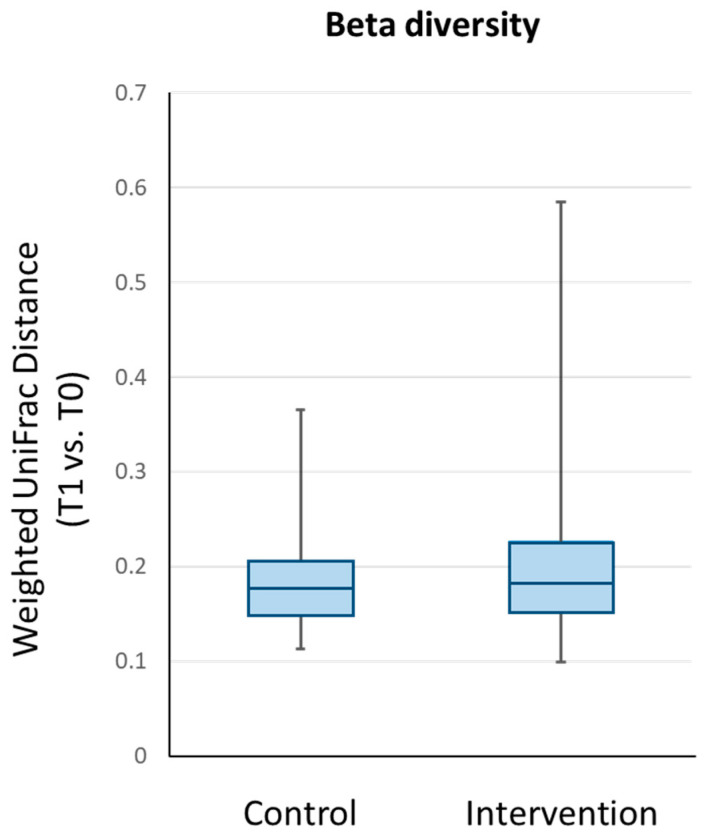
Figure 4.
Beta diversity analysis of the participants’ intestinal microbiota using the phylogenetic-based weighted UniFrac distance. The box and whisker plots show the median, lower quartile, upper quartile, minimum value and maximum value of the within-subject pairwise distances between T1 and T0 for each group.

