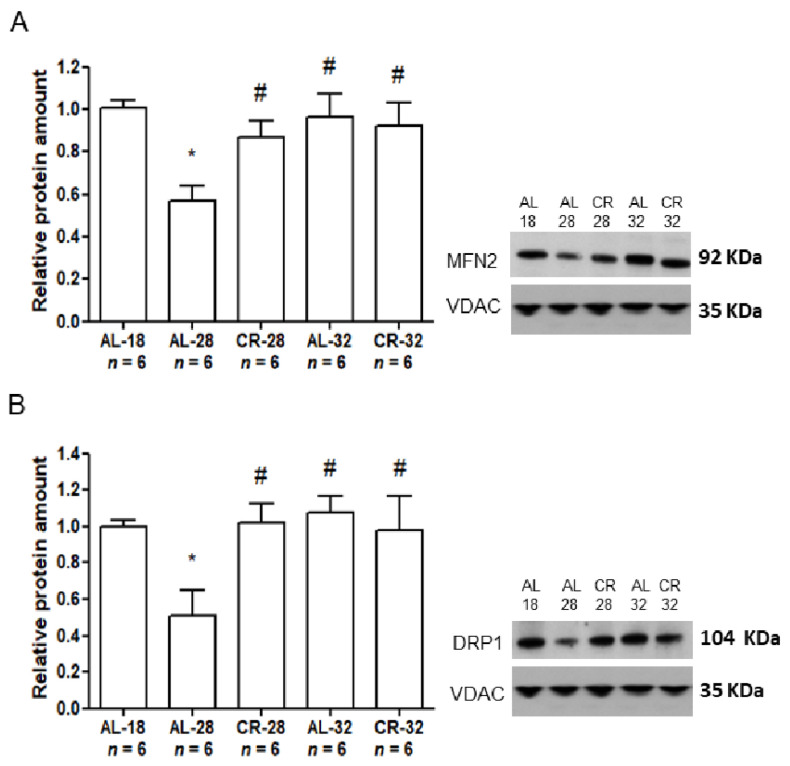
Figure 5.
Amounts of MFN2 and DRP1 proteins in isolated liver mitochondria from AL-18, AL-28, CR-28, AL-32, and CR-32-month-old rats. (A). In the inset, a representative Western blot was carried out in one rat from each of the assayed groups. Immunoreactive bands, from top to bottom, represent, respectively, the signals from MFN2 and VDAC. The histogram shows the quantification of the intensity of the bands of MFN2 normalized to the intensity of VDAC. (B). In the inset, a representative Western blot was carried out in one rat from each of the assayed groups. Immunoreactive bands, from top to bottom represent, respectively, the signals from DRP1 and VDAC. The histogram shows the quantification of the intensity of the bands of DRP1 normalized to the intensity of VDAC. (A,B) Data represent the results from triplicate Western blot experiments and were analyzed using the One-way ANOVA test and Tukey’s multiple comparison test. Bars represent the mean values and SD for the five experimental groups. Data were normalized against the value of the AL-18 rats, fixed as 1. * p < 0.05 versus AL-18 rats, # p < 0.05 versus AL-28 rats. n: Number of analyzed animals.

