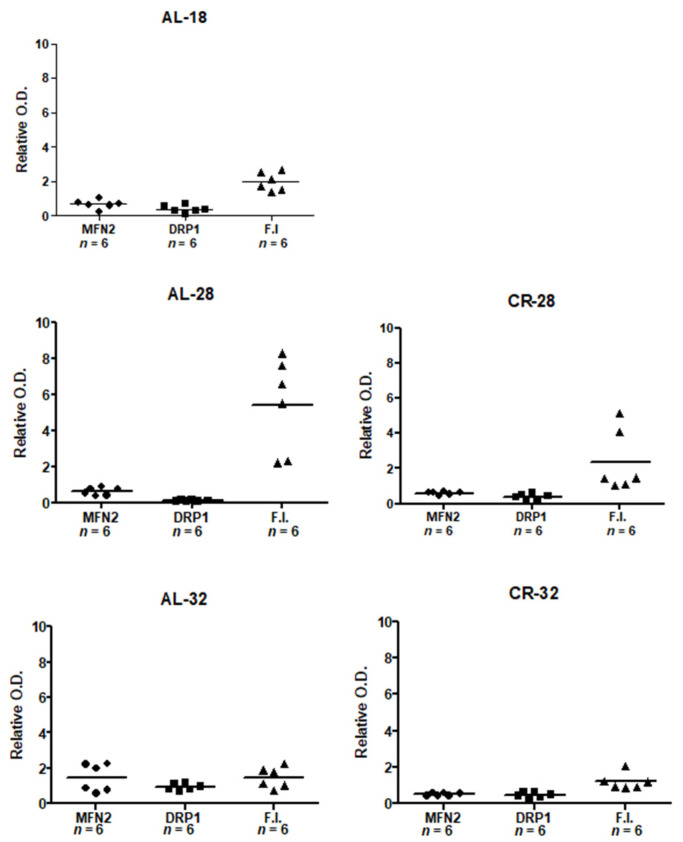
Figure 6.
Scatter plots for values of MFN2 and DRP1 protein amounts and of the fusion index (FI) of all the assayed animals. As for MFN2 and DRP1, symbols show the quantification of the intensity of immunoreactive bands of MFN2 or DRP1 normalized to the intensity of VDAC in isolated mitochondria from each rat. All data represent the results from triplicate Western blot experiments. FI was calculated from the ratio of MFN2 and DRP1 intra-mitochondrial protein amounts for each of the assayed animals. The horizontal line represents the mean value. n: Number of analyzed animals.

