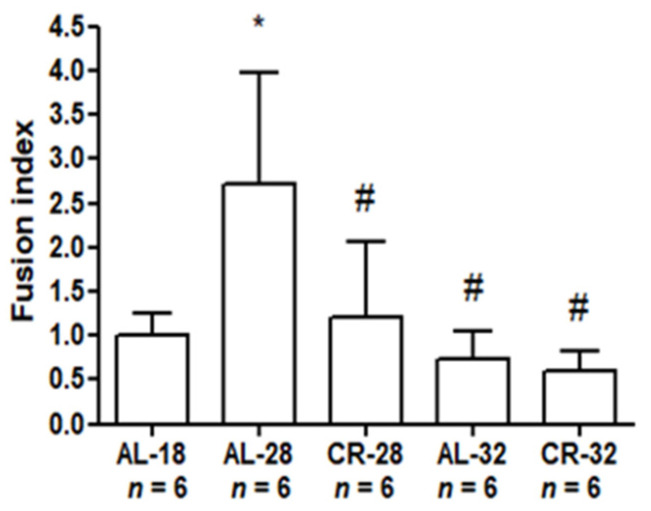
Figure 7.
Fusion index (FI) values in isolated liver mitochondria from AL-18, AL-28, CR-28, AL-32, and CR-32-month-old rats. Bars represent the mean values and SD of the ratio, calculated for each group of rats from the individual values in Figure 6. Comparisons were made with respect to the value of the AL-18 rats, fixed as 1. * p < 0.05 versus AL-18 rats; # p< 0.05 versus AL-28 rats. n: Number of analyzed animals.

