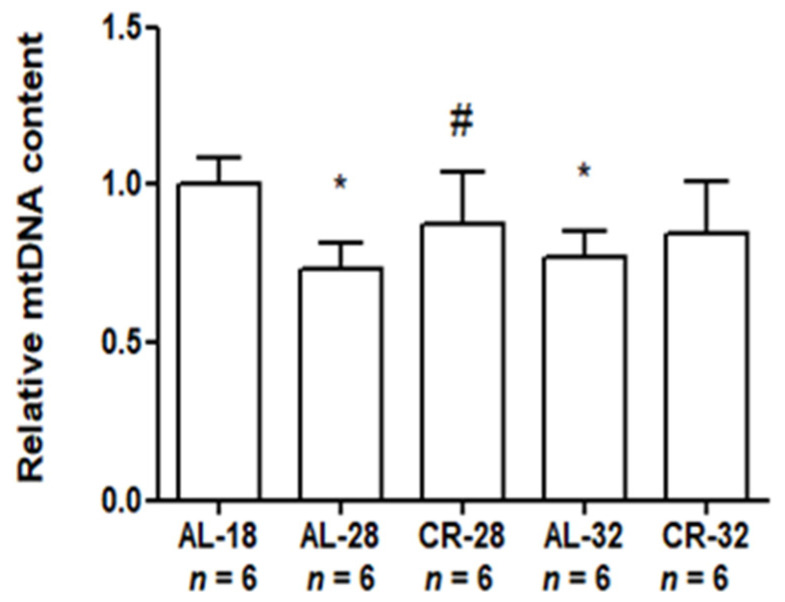
Figure 8.
Relative content of mitochondrial DNA (mtDNA) in liver from AL-18, AL-28, CR-28, AL-32, and CR-32-month-old rats. Bars represent data obtained from two independent experiments conducted in triplicate and analyzed using the One-way ANOVA test and Tukey’s multiple comparison test. In the graphical representation, data have been normalized against the value of the AL-18 rats, fixed as 1, and shown as the mean value and SD. * p < 0.05 versus AL-18 rats; # p < 0.05 versus AL-28 rats. n: Number of analyzed animals.

