Figure 1.
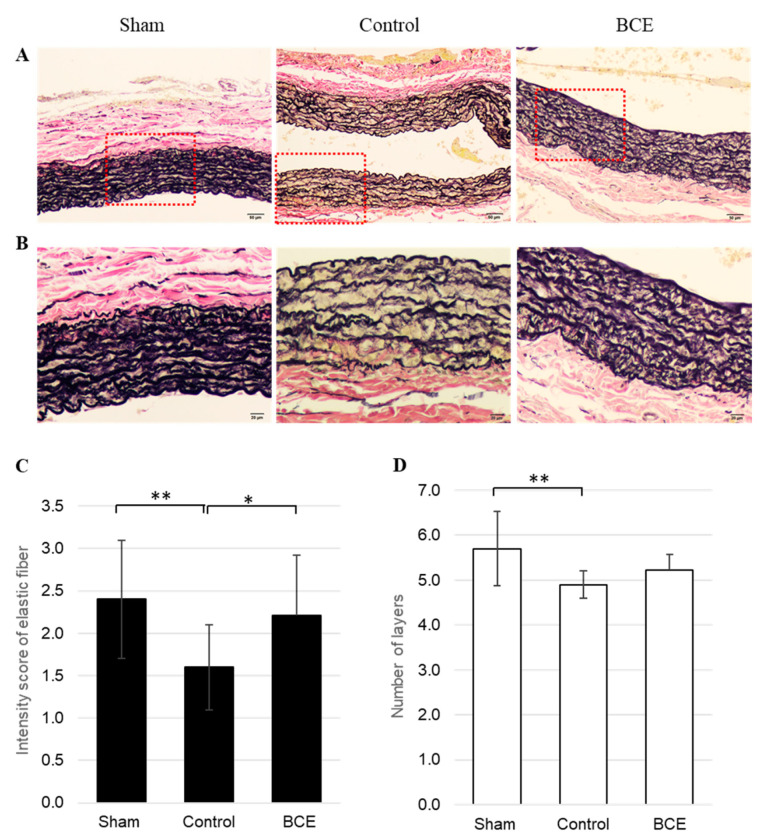
Representative images and semi-quantification of elastic fibers in Elastica van Gieson-stained tissues. (A) 100× magnification (scale bar = 50 µm) and (B) 200× magnification (scale bar = 20 µm) of the boxed area shown in (A). (C) Staining intensity of elastic fibers in the aortic tunica media semi-quantified at 3 intensities: 1, 2, and 3. (D) Evaluation of the number of elastic fiber layers in the aortic tunica media. Data are shown as means ± SEM; n = 10 (Sham), n = 20 (Control) and n = 14 (BCE). * p < 0.05, ** p < 0.01. Sham, sham surgery rats; Control, OVX rats without BCE treatment; BCE, OVX rats treated with 3% BCE; OVX, ovariectomized; BCE, blackcurrant (Ribes nigrum L.) extract; SEM, standard error of the mean.

