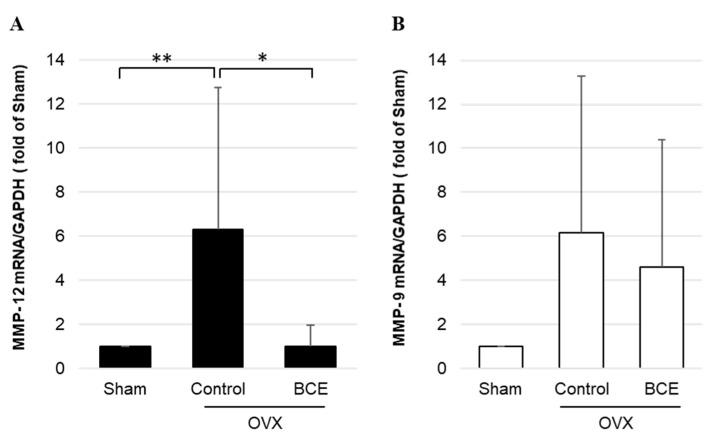
Figure 5.
Mmp mRNA levels in OVX BCE rats. (A) Mmp-12 and (B) Mmp-9 mRNA levels quantified by RT-qPCR. Data are shown as the mean ± SEM of at least three independent experiments (n = 9). * p < 0.05, ** p < 0.01, vs. Sham rats. Sham, sham surgery rats; Control, OVX rats without BCE treatment; BCE, OVX rats treated with 3% BCE; OVX, ovariectomized; BCE, blackcurrant (Ribes nigrum L.) extract; MMP, matrix metalloproteinase; RT-qPCR, quantitative reverse-transcription polymerase chain reaction; SEM, standard error of the mean.

