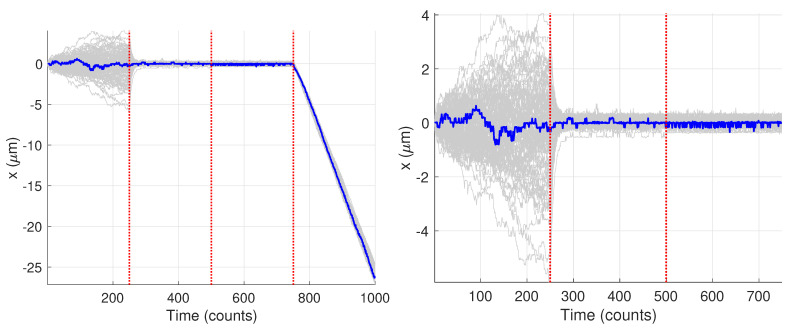
Figure 9.
Synthetic motion trajectories generated from image data over (left) the full 1000 frames and (right) over the first 750 frames to highlight the diffusive nature of the motion. The example trajectory used is highlighed in blue. Vertical red dashed lines are where the model values changed according to the values in Table 1.

