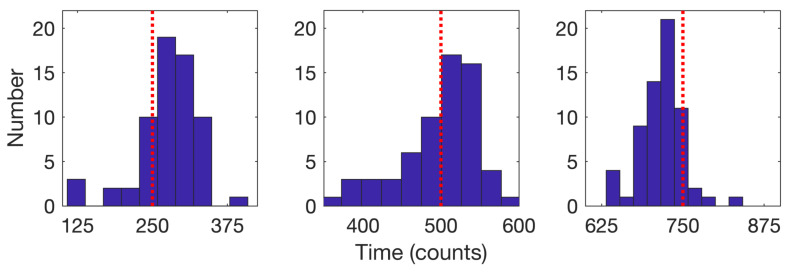
Figure 12.
Histograms of the detected times of model changes when three changes were detected (64 trajectories) for the (left) first, (center) second, and (right) third change. Red dotted lines indicate the true change times of 250, 500, and 750. Mean detected times are 276.2 for the first, 497.1 for the second, and 717 for the third.

