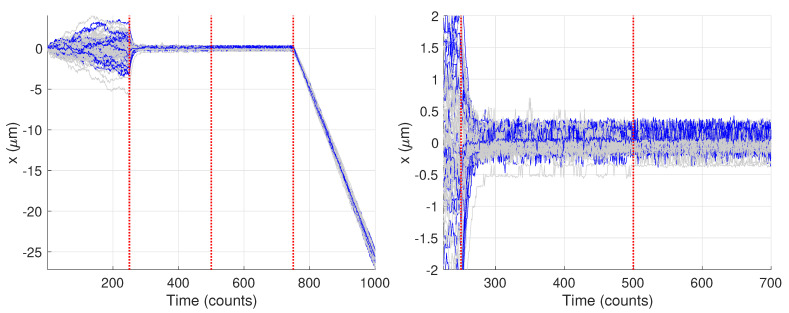
Figure 14.
Synthetic motion trajectories generated from image data with the 26 trajectories yielding only two changes highlighted in blue. Vertical red dashed lines are where the model values changed. (left) Full trajectories. (right) Zoom in to highlight differences between the blue and gray trajectories.

