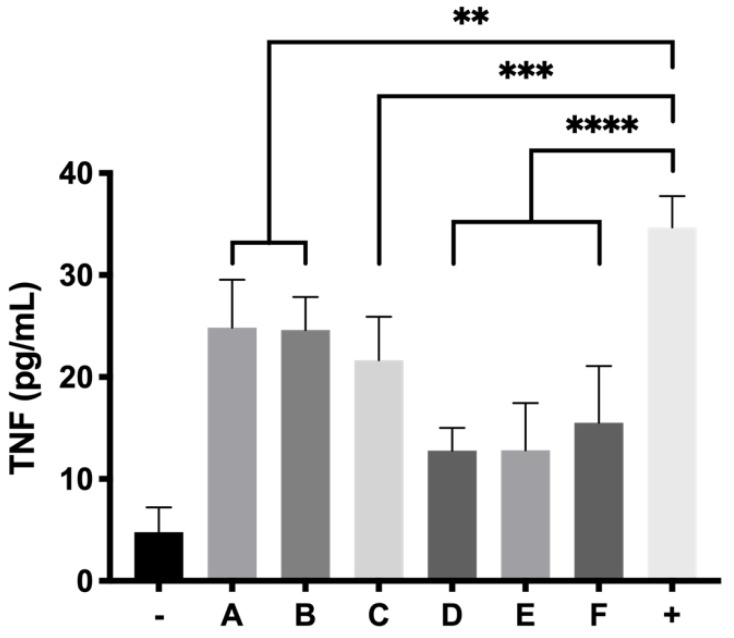
Figure 16.
TNFα activity of RPE-1 cells exposed to final formulations DX 0.2% (A), DX 0.2% + Idebenone 1 µM (B), DX 0.2% + TPGS 0.02% (C), KT 0.5% (D), KT 0.5% + Idebenone 1 µM (E) and KT 0.5% + TPGS 0.02% (F), respectively, in response to LPS induced inflammation. p ≤ 0.01 (**), p ≤ 0.001 (***) and p ≤ 0.0001 (****).

