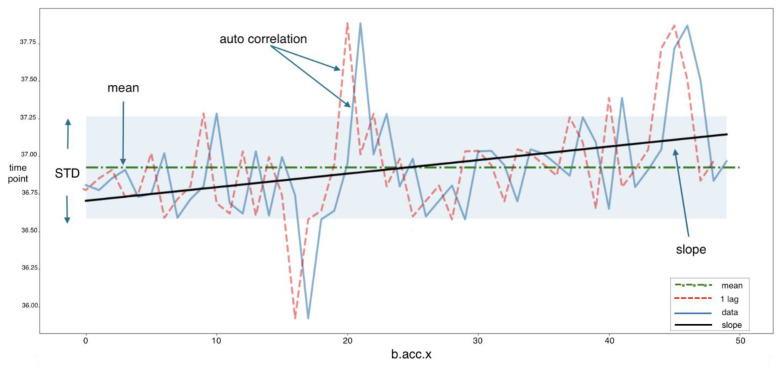
Figure A1.
Four statistical features were built, based on continuous variables that accounts for stationarity in temporal processes. The mean represents the overall mean of a subject’s entire task. The standard deviation (std) corresponds to the variance of a subject’s behavior throughout the entire task. The auto correlation is the correlation between a feature and its corresponding one time-point (5 min) lagged data (1 lag). The slope is the trend captured by a linear regression throughout the entire stay.

