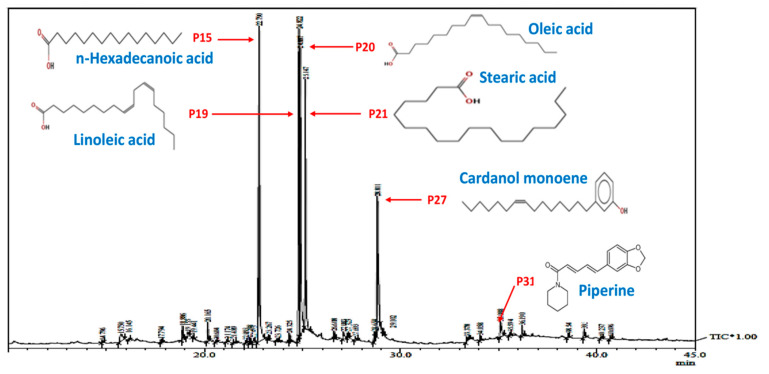
Figure 3.
Gas chromatography mass-spectroscopic analysis. Typical GC–MS chromatogram of PLE showing a total 37 peaks (P) for different bio-actives compounds including six major compounds as n-hexadecanoic acid (P15—21.95%), linoleic acid (P19—20.45%), oleic acid (P20—18.01%), stearic acid (P21—13.99%), cardanol monoene (P27—11.92%) and piperine (P31—1.83%).

