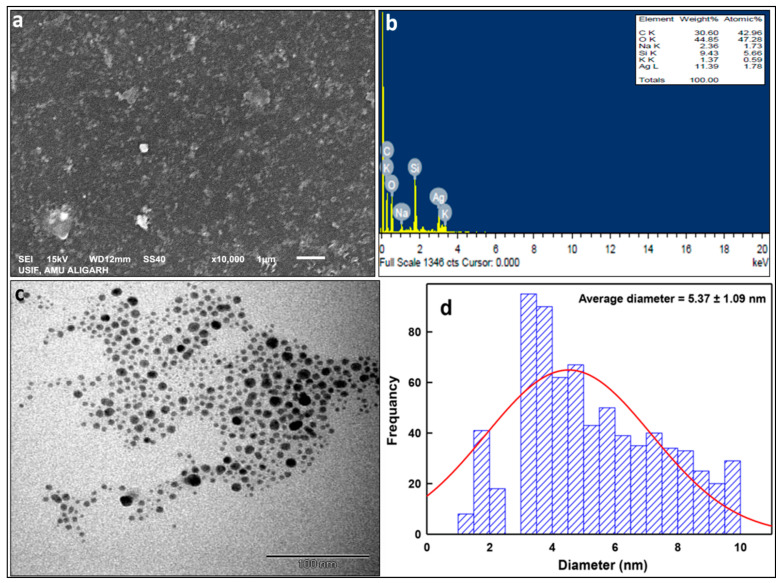
Figure 5.
Electron microscopic analyses. Panel (a) shows SEM micrographs of LIV-AgNPs. Whereas, energy dispersive X-ray spectrum in panel (b) represents the percentage of Ag, C, O, NA, K and Si elements present in LIV-AgNPs. Panel (c) demonstrates TEM image of LIV-AgNPs whereas, panel (d) depicts the particle size distribution in TEM images, respectively.

