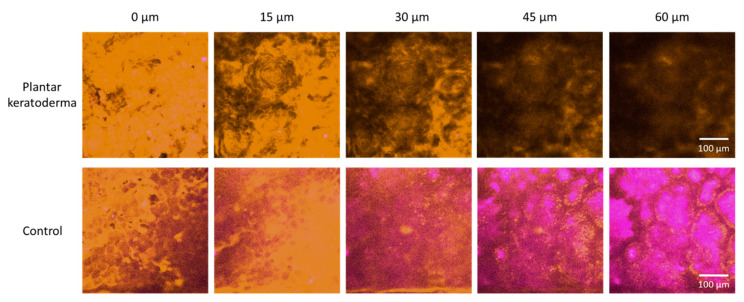
Figure 5.
Nonlinear microscopy (NLM) horizontal optical slicing through skin biopsies from the epidermis towards the dermis. Upper panel: plantar keratoderma of the patient lower panel: healthy control. Representative images acquired at five different vertical positions along the z-axis, 15 μm apart in each case, through the skin biopsies positioned horizontally on the microscopy slides. Orange color (590/45 nm bandpass emission filter) and magenta color (405/20 nm bandpass filter) indicate two-photon absorption fluorescence (TPF) and second-harmonic generation (SHG) signals, respectively, in the imaging plane. Scale bar: 100 μm. Pixel size: 0.8476 pixels/µm.

