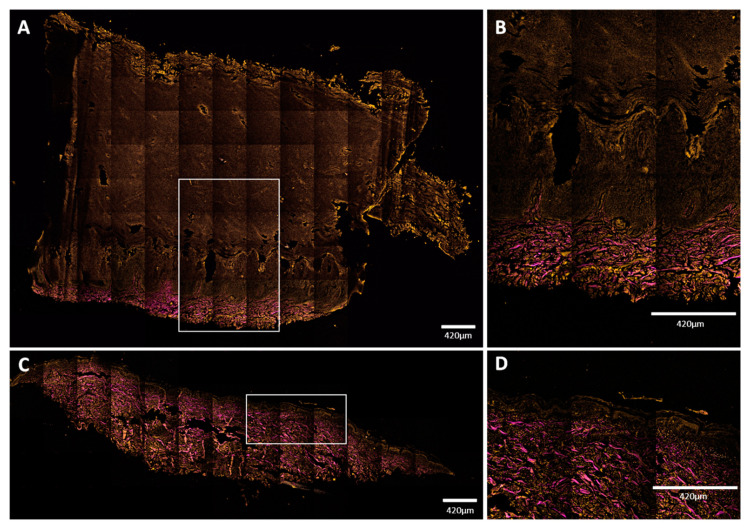
Figure 7.
Mosaic NLM images of vertical skin sections. (A,B) Plantar keratoderma of the patient; (C,D) healthy control. Keratin had TPF signal in the orange channel, while collagen had SHG signal, indicated with magenta color. (A,B) Dermal papillae appeared in magenta; upwards, the basal keratinocyte layer can be seen in orange, followed by widened cellular layers of the epidermis and the increased amount of lamellar structure of the cornified keratinocytes. Total thickness of the epidermis was around 3000 μm (range: 3079–3373 μm). (C,D) The structure and proportion of the epidermis appeared to be as assumed in healthy subjects. Thickness of the epidermis was about 100 μm (range: 96–146 μm). Scale bar: 420 μm. Pixel size: 0.1571 pixels/µm (A,C); 0.4012 pixels/µm (B,D).

