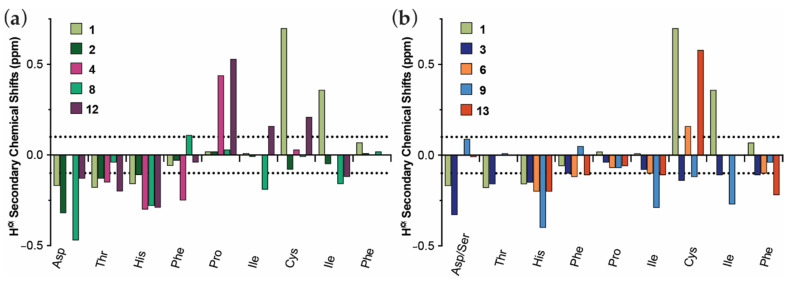
Figure 4.
Comparison of the Hα secondary chemical shifts for the mini-hepcidin epitope (DTHFPICIF) for hepcidin and different hepcidin analogues. All 1H NMR spectra were recorded at 298 K on a Bruker Avance 600 MHz spectrometer. Spectra were assigned using CCPNMR Analysis [27]. (a) Comparison between hepcidin 1, Hep9 2, Hep9[MeIle6, MeIle8] 4, cHep9 8, and cHep9[MeIle6, MeIle8] 12. (b) Comparison between hepcidin 1, Hep9[Ser1] 3, Hep9[Ser1, MeThr2, MeIle8] 6, cHep9[Ser1] 9, and cHep9[Ser1, MeThr2, MeIle8] 13.

