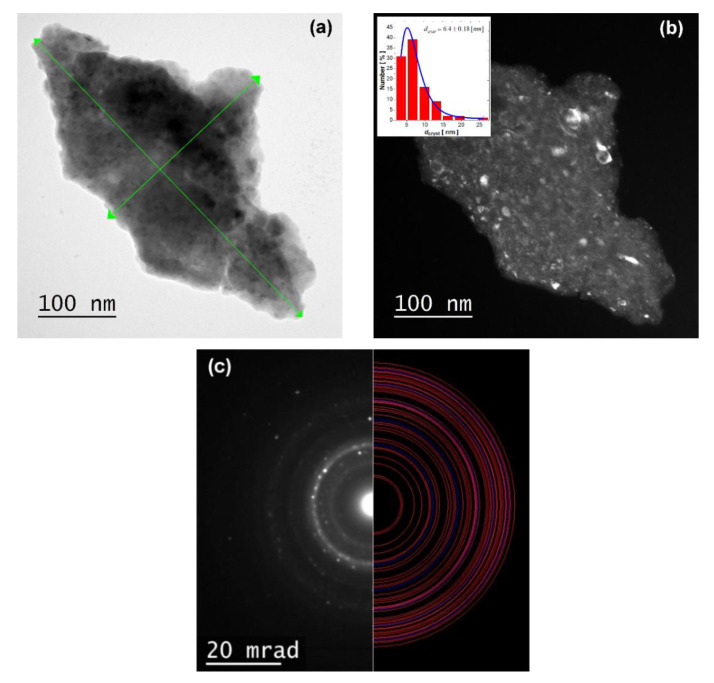
Figure 5.
TEM micrographs for the SmCo5/α-Fe (5%wt. of α-Fe) sample milled for 10 h: (a) bright-field image (b); dark-field image with visible crystallites structure. Insert represents crystallite size distribution (CSD) histogram; (c) selected area electron diffraction (SAED) pattern indexed with CaCu5 (red lines) and α-Fe (blue lines) phases.

