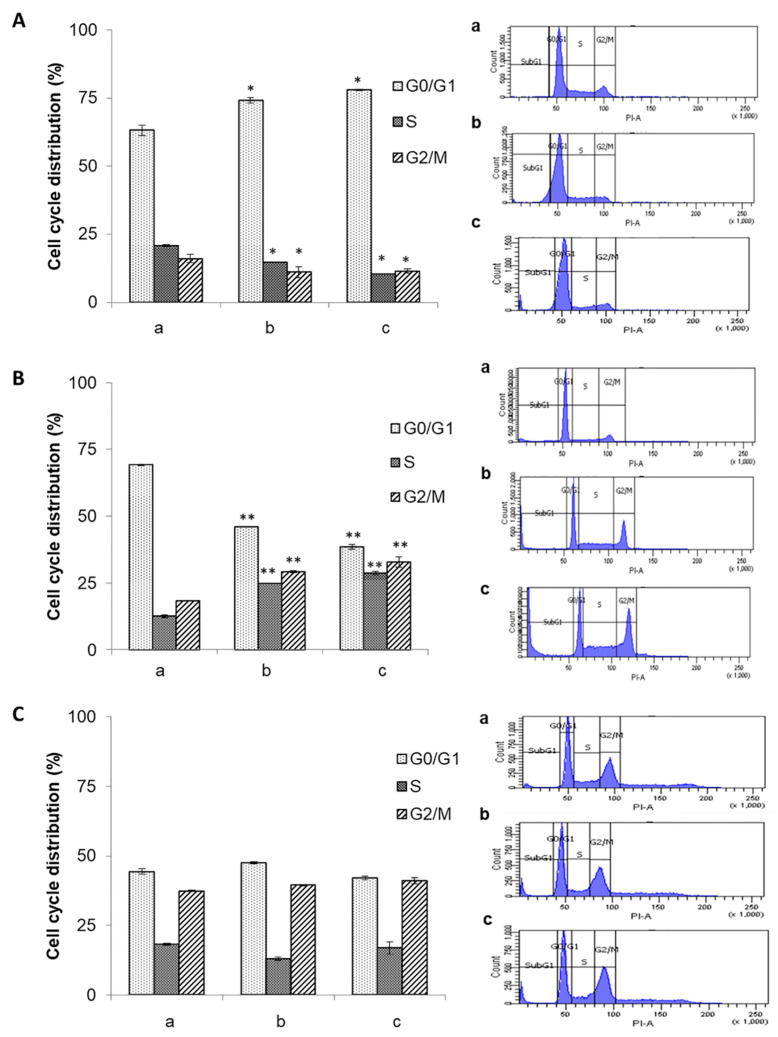
Figure 3.
Modulation of the cell cycle by the ethanolic extract from defatted seeds of Euphorbia lathyris. Cell lines were treated with IC25 and IC50 doses of the extract. (A) T84 cell line; (B) HCT-15 cell line; and (C) CCD18 cell line (cycle (a: control; b: IC25; c: IC50). Results of the FACScan analysis are expressed as the percentage of labeled cells in each cell cycle phase. Data are presented as mean ± standard deviation of triplicate cultures. * Data with significant differences between treated and non-treated cells (p < 0.05). ** p < 0.01, vs. the respective control group.

