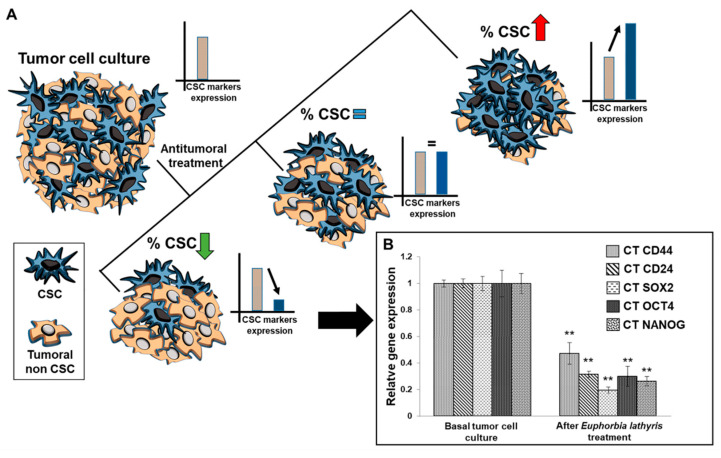
Figure 5.
RT-qPCR analysis of cancer stem cell markers. (A) Scheme of the possible responses after antitumor treatment in the basal population of tumor cells. The expression levels of cancer stem cell (CSC) markers are related to the percentage of CSC in the tumor culture after antitumor treatment. (B) Representative graph showing the relative gene expression of stemness-related markers before (basal) and after exposure to the ethanolic extract from the defatted flour of Euphorbia lathyris. Data are presented as mean ± standard deviation of three independent experiments; ** p < 0.01 vs. the respective control group.

