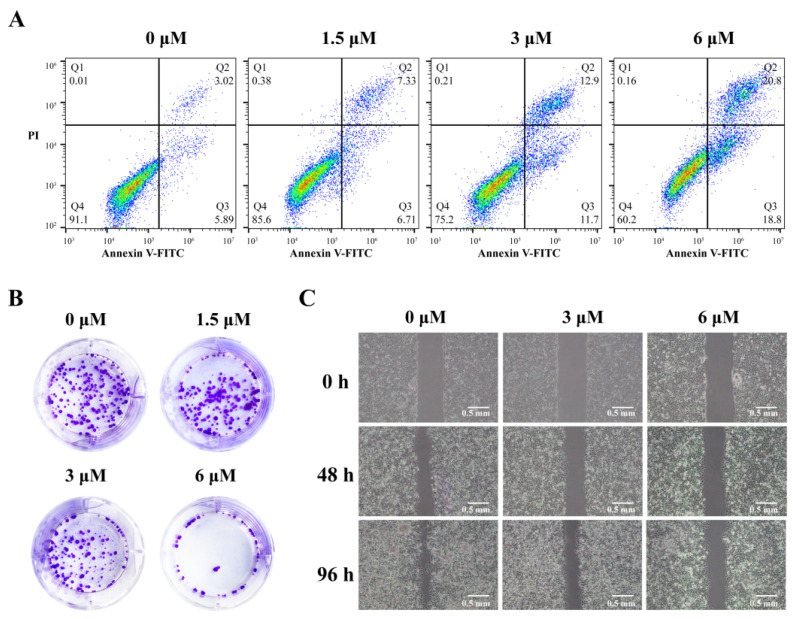
Figure 6.
(A) Flow cytometry dot plot of apoptosis in MCF-7 cells induced by 3c at 1.5, 3, and 6 μM, respectively. (B) The colony formation of MCF-7 cells after being treated with 3c (1.5, 3, and 6 μM) for 9 days. (C) The metastasis of MCF-7 cells after being treated with 3c (3 and 6 μM) for the indicated times.

