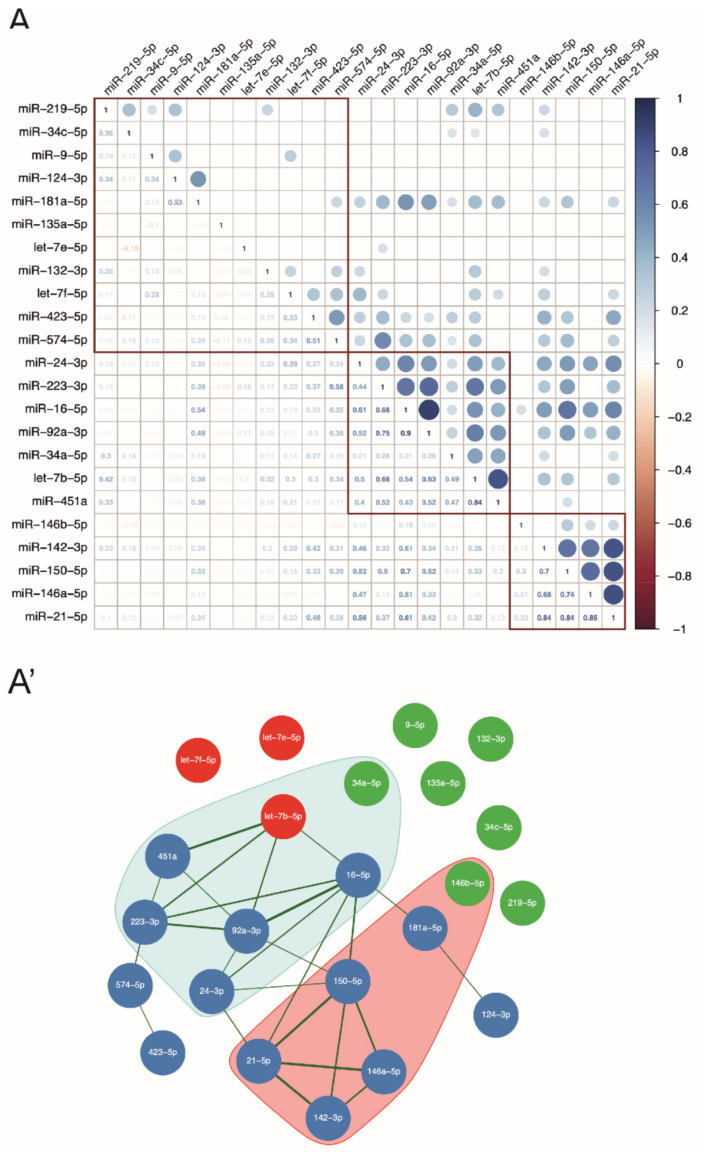
Figure 2.
Let-7b-5p is a hub in the network of miRNAs in the CSF of patients with MS. (A) Heat map of Pearson’s correlation coefficients (r) between 23 miRNAs (relative to miR-204-5p, according to the ΔCt calculation) detected by qPCR in the CSF of the main cohort of patients (n = 166) at T0. In the upper triangle, r values of significant correlation (p < 0.05) were represented by coloured circles according to the scale (r > 0 is positive correlation, 0 no correlation and <−1 is negative correlation). In the lower triangle, r values are reported following the color code. Squares represent three different clusters identified by hierarchical clustering using the cutree R function with k = 3. Only statistically significant correlations with FDR < 0.05 are shown. (A’) Network representation of miRNA correlation. In red, there are detected members of the let-7 family (let-7b-5p, let-7e-5p and let-7f-5p). Blue nodes are other miRNAs relevant for MS, which correlate each other and/or with let-7b-5p (r ≥ 0.5). In green are miRNAs with r < 0.5. Pink and light blue areas represent, respectively, the first and the second correlation clusters, highlighted in panel A of the figure by the two lower squares.

