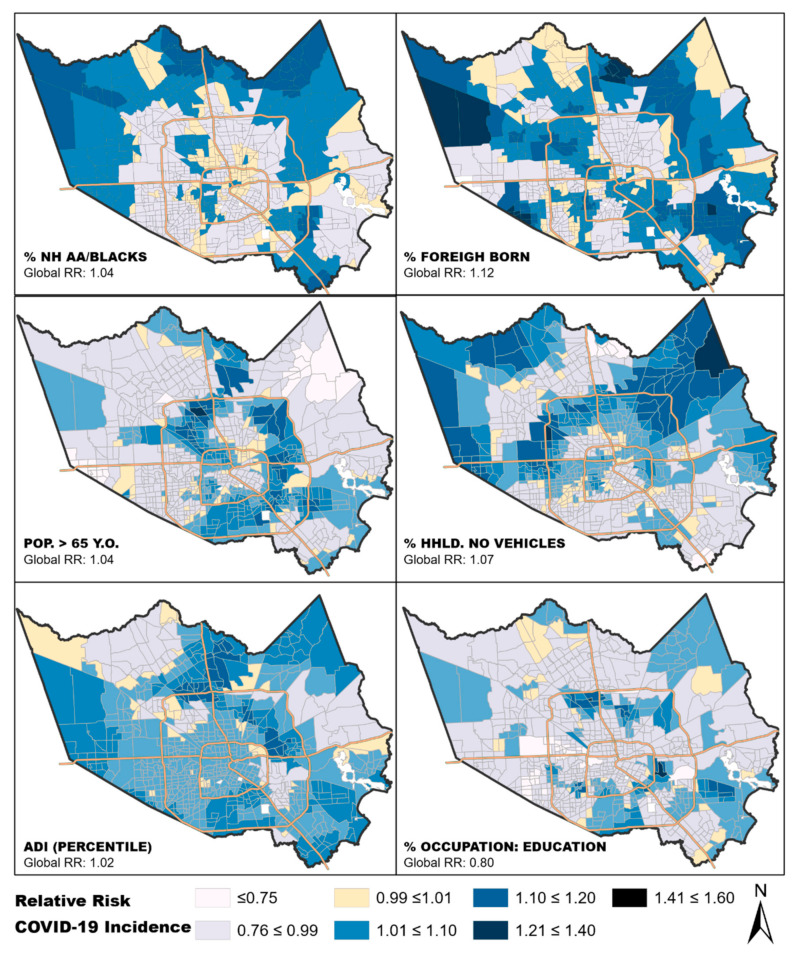
Figure 3.
Maps of Harris County census tracts that show local associations between the variables in the final aspatial model and COVID-19 incidence. The local beta coefficients were exponentiated (RR) to show the sensitivity of COVID-19 incidence to a change of 10-unit difference in each of the neighborhood characteristics shown above, specific to each census tract. The middle class (0.99–1.01) crosses 1.0. To simplify interpretation, the same legend was applied to all maps. Values less than 0.99 suggest census tracts where increase in the proportion of the independent variable is associated with decreased RR for COVID-19, while values above 1.01 suggest increased RR for COVID-19 with increased proportion of the independent variable (10-unit increase).

