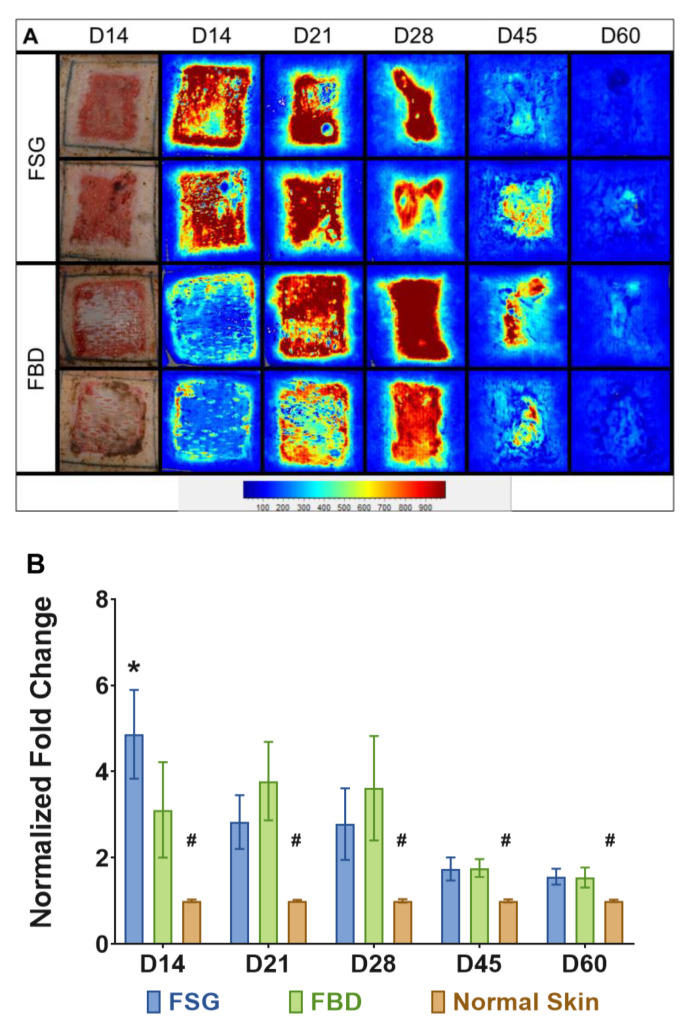
Figure 5.
Laser Speckle Imaging. (A) Two representative wounds are shown for both treatment groups. Digital images at day 14 and the corresponding laser speckle images (LSI) throughout the experiment are shown. The heatmap scale is shown below in which blue represents low perfusion and red if highly perfused. Note that the perfusion in uninjured skin is a sky blue and as the wounds heal by day 60, the borders of the wound are no longer obvious. (B) Quantitation of LSI measurements represented as a fold change above the normal perfusion around each wound and normalized to the growth controls on each animal at the designated time point (# = p < 0.005 for normal skin vs. treatment groups; * = p < 0.05 for FSG vs. FBD as determined by 2-way repeated measures ANOVA with Tukey post-hoc test, n = 12). Fetal bovine dermis (FBD); Fish skin graft (FSG).

