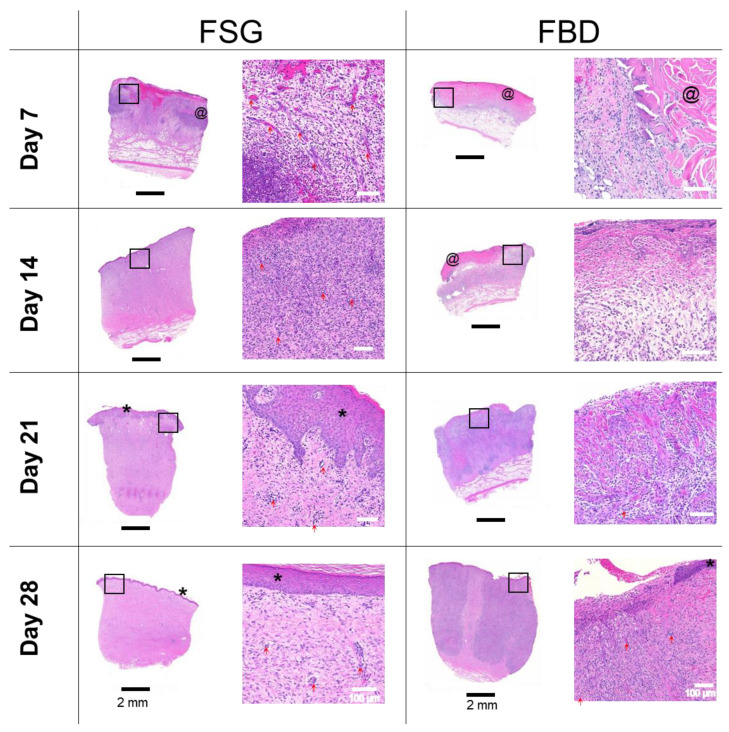
Figure 6.
H&E Histology. Representative H&E images of biopsy punches harvested at the indicated time points. Images on left are the entire biopsy punch with black scale bars = 2 mm while the area indicated by the black box is the enlarged image on the right with white scale bars = 100 um. * = newly formed epidermis; @ = residual pieces of treatment in wound bed; red arrows are pointing out some of the newly formed blood vessels. Fetal bovine dermis (FBD); Fish skin graft (FSG).

