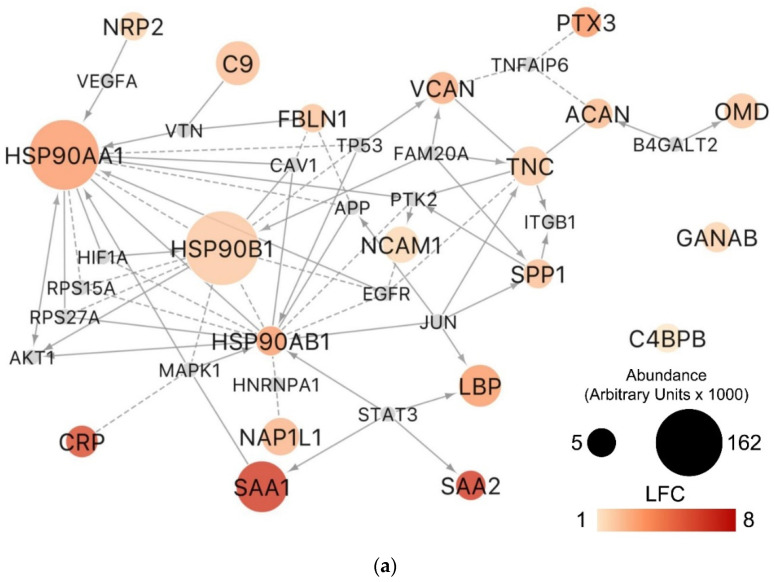
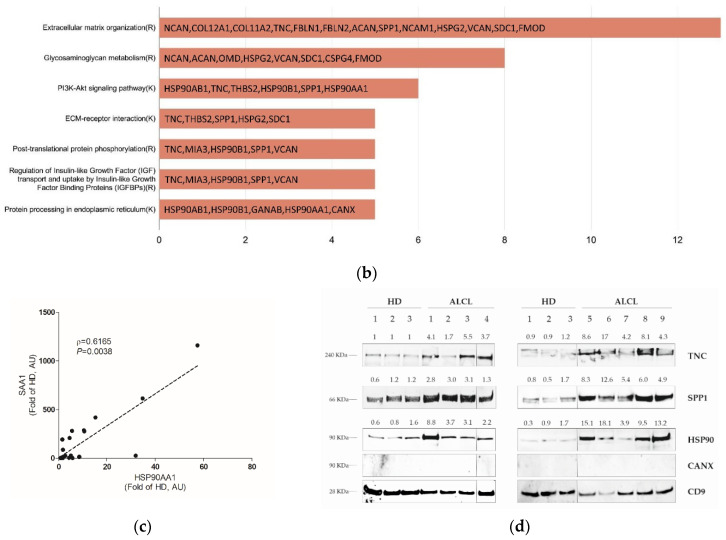
Figure 4.
Pathway modules involving proteins overrepresented in S-EVs of ALCL patients highlight phosphatidylinositol 3-kinase (PI3K)/AKT signaling pathway proteins in the plasma S-EVs cargo in ALCL. (a) Pathway-derived network and (b) Reactome and Kyoto Encyclopedia of Genes and Genomes (KEGG) modules significantly enriched (FDR < 0.01) by the proteins overrepresented in ALCL S-EVs. In the network, node size indicates the protein abundance (arbitrary units ×1000) in ALCL; color shades indicate the log2 fold change (LFC) of protein abundance with respect to healthy donors (HD). Only the overexpressed proteins with average abundance ≥ 5000 in ALCL are shown. Small grey nodes represent first neighbors connecting two or more of the proteins overrepresented in ALCL S-EVs. Edges indicate different types of experiments from which the relationship was determined: expression regulation (arrow), complex (solid line) or predicted (dashed line). (c) Scatterplot showing the Spearman correlation between heat shock protein 90 isoform alpha 1 (HSP90AA1) and serum amyloid A1 (SAA1) in 20 ALCL-derived S-EVs (ρ = 0.6165, p = 0.0038). Data in arbitrary units (AU) are expressed as fold of HD. (d) Western blotting of tenascin C (TNC), osteopontin (SPP1) and HSP90 in ALCL and HD samples. Band densities were acquired using ImageJ software and expressed as a fold of HD bands’ mean density. CD9 was used as a loading control. Vertical lines were inserted to indicate repositioned gel lanes. Expression levels between ALCLs and HDs were compared by using the Mann–Whitney test.


