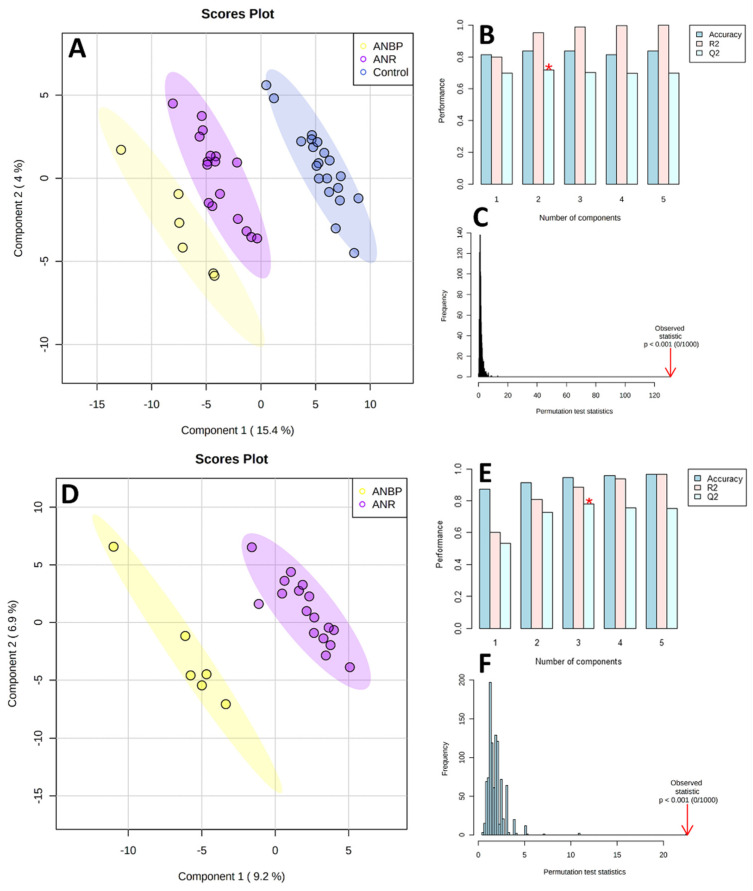
Figure 1.
Partial least square discriminant analysis (PLS-DA) models to discriminate healthy controls (CTRL), restricting (ANR), and binge-purging (ANBP) anorexia nervosa patients (A) and ANBP and ANR patients (D). The explained variance of each component is shown in brackets on the corresponding axis. (B,E) Accuracy, R2, and Q2 results estimate via cross-validation. Q2 is an evaluation of the predictivity ability of the model. In each cross-validation, the predicted data are compared with the original data, and the sum of squared error is calculated. The better prediction performances are provided by the model, with three components providing for the higher Q2 (marked with a red star). (C,F) Permutation test results based on 1000 iterations.

