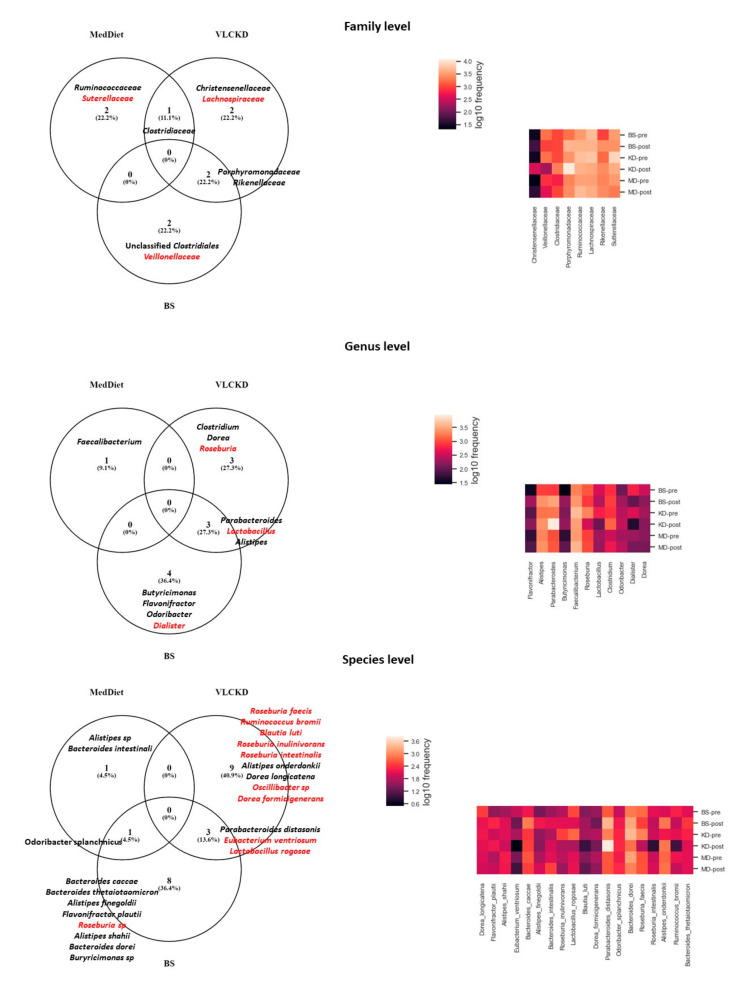
Figure 2.
Taxon that changed significantly in each intervention at different taxonomic levels. In red color: taxon that decreased their abundance at the end of the intervention. In black color: taxon that increased their abundance at the end of the intervention. MedDiet: Mediterranean Diet group (n = 21). BS: Bariatric surgery group (n = 22). VLCKD: very-low calorie ketogenic diet group (n = 18).

