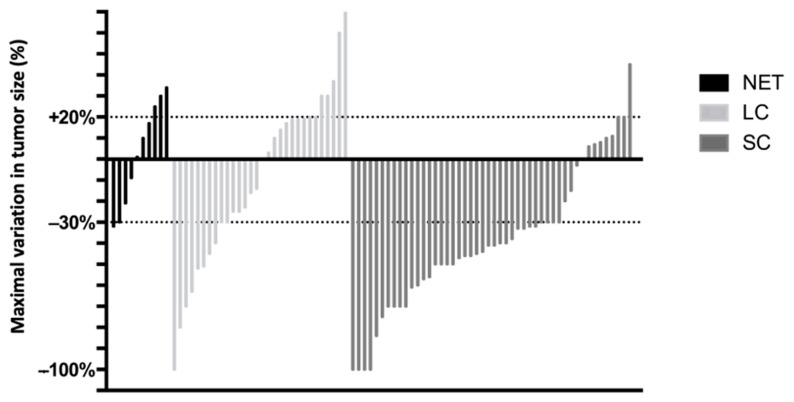
Figure 3.
Waterfall plot of maximal variation (%) in tumor size compared to baseline scans, determined by the Response Evaluation Criteria in Solid Tumors (RECIST) method. The dotted lines correspond to the thresholds for progression (+20%) or an objective response (−30%). LCNEC, large-cell neuroendocrine carcinoma; NET, neuroendocrine tumor; SCNEC, small-cell neuroendocrine carcinoma.

