Figure 3.
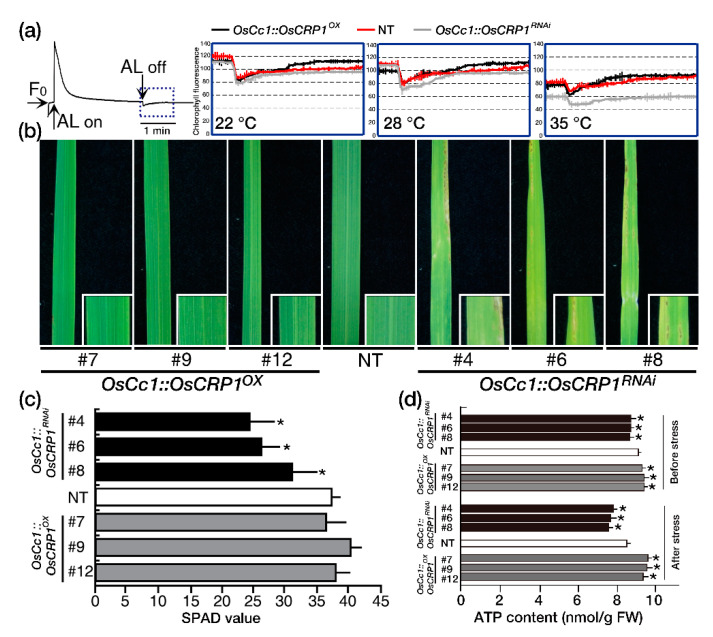
Monitoring of NDH-dependent CET activity by chlorophyll a fluorescence. (a) Chlorophyll a fluorescence in OsCc1::OsCRP1OX, NT and OsCc1::OsCRP1RNAi. 5-week-old plants grown under chamber conditions. The middle portions of leaves were used for measurements. The post-illumination chlorophyll fluorescence curve, which represents NDH-dependent CET, was therefore magnified from the blue box area for analysis. Values are means (±SD) of three independent measurements. (b) OsCc1::OsCRP1OX, NT, and OsCc1::OsCRP1RNAi plants were grown for 2 weeks under chamber conditions and light intensities of 170~180 μmol m−2 s−1 prior to stress treatment. Plants were then transferred to light intensities of 240~250 μmol m−2 s−1 and phenotyped. All light measurements were made with a LI-250A Light Meter (LI-COR, Lincoln, NE, USA), and photos were obtained 2 weeks after treatment. The analysis was carried out for three biologicals with three technical replicates each. (c) SPAD values for OsCc1::OsCRP1OX, NT and OsCc1::OsCRP1RNAi leaves, representing the amount of chlorophyll per leaf. The values were measured for 10 leaves of three representative transgenic lines and NT plants using a Chlorophyll Meter SPAD-502Plus. Data bars represent the mean ± SD of two biological replicates, each of which had three technical replicates. Asterisks indicate significant differences compared with NT (* p < 0.05, One-way ANOVA). (d) ATP contents in leaves of the OsCc1::OsCRP1OX, NT and OsCc1::OsCRP1RNAi plants under before and after light stress conditions. Ten plants were used for each line, and the middle portion of the second leaf from the top was taken for analysis. Data bars represent the mean ± SD of three biological replicates, each of which had two technical replicates. Asterisks indicate significant differences compared with NT (* p < 0.05, One-way ANOVA).

