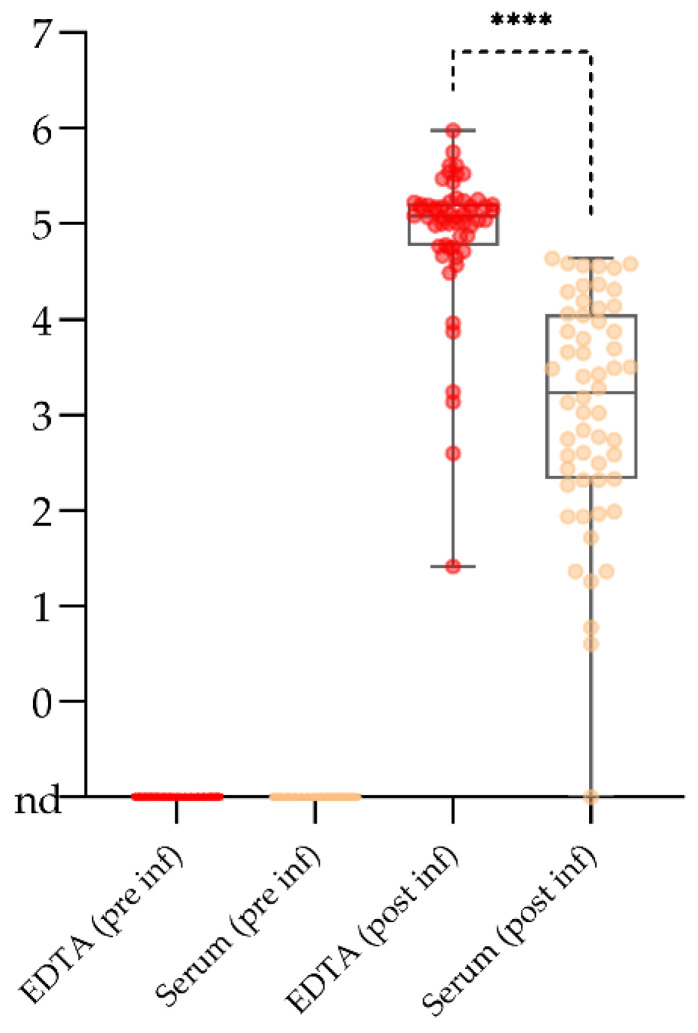
Figure 2.
Overall comparison of log10 genome copy numbers in EDTA blood and serum (prior to infection = pre inf; post infection = post inf). The boundaries of the boxes indicate the 25th and 75th percentiles, the line within the box marks the median. Whisker boundaries indicate minimum and maximum values. A paired t-test was performed to test the significance with a resulting **** p-value of < 0.0001 for samples taken post infection. nd = not detected.

