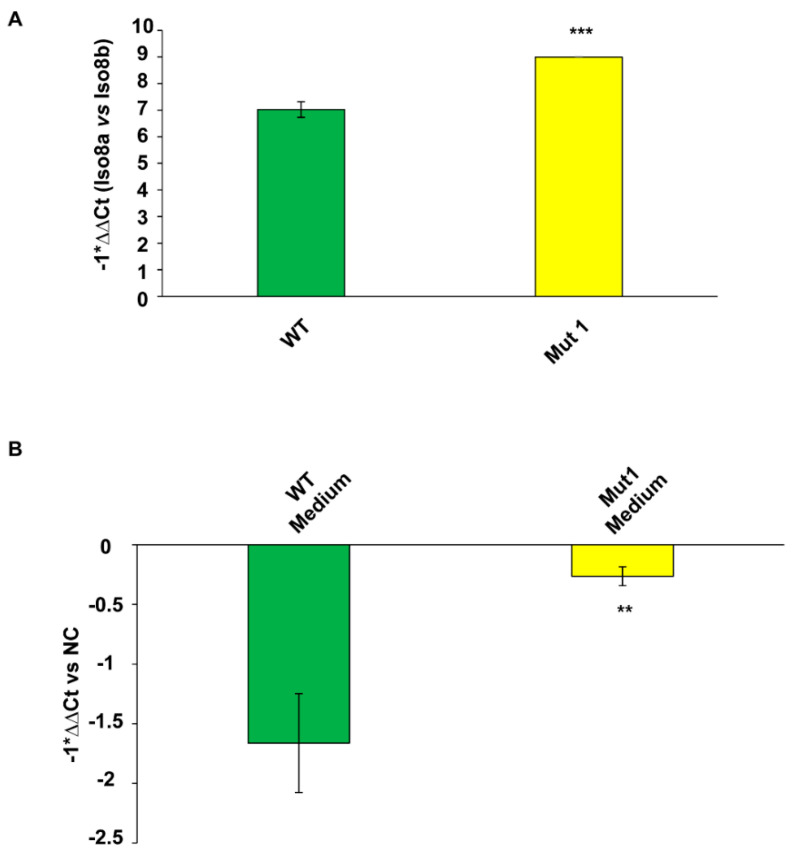
Figure 5.
CAS-1 transfected with Mut1 circSMARCA5 show an increased (A) intracellular Iso8a to Iso8b VEGFA mRNA isoform ratio and (B) amount of secreted total VEGFA mRNA in cell culture medium as compared to CAS-1 transfected with WT circSMARCA5. (A) Data are represented as mean ± standard deviation of −1*ΔΔCt (the lower the value, the lower the relative expression of intracellular Iso8a vs. Iso8b VEGFA mRNA isoform; vice versa, the higher the value, the higher the intracellular Iso8a to Iso8b mRNA isoform ratio). ∆Ct values of each mRNA isoform were calculated from qRT-PCR experiments by using TATA-box binding protein (TBP) mRNA as endogenous control. ∆∆Ct was obtained subtracting ∆Ct of Iso8b to ∆Ct of Iso8a. (B) Data are represented as mean ± standard deviation of −1*ΔΔCt (the lower the value, the lower the expression of total VEGFA mRNA in cell culture medium; vice versa, the higher the value, the higher, the expression of total VEGFA mRNA in cell culture medium). Actin beta (ACTB) mRNA was used as endogenous control to calculate ∆Ct. Cell culture medium from CAS-1 transfected with an empty pcDNA3 vector (negative control, NC) was used as a calibrator to calculate ∆∆Ct. *** p-value < 0.001, ** p-value < 0.01 (n = 3, Student’s t-test vs. WT).

