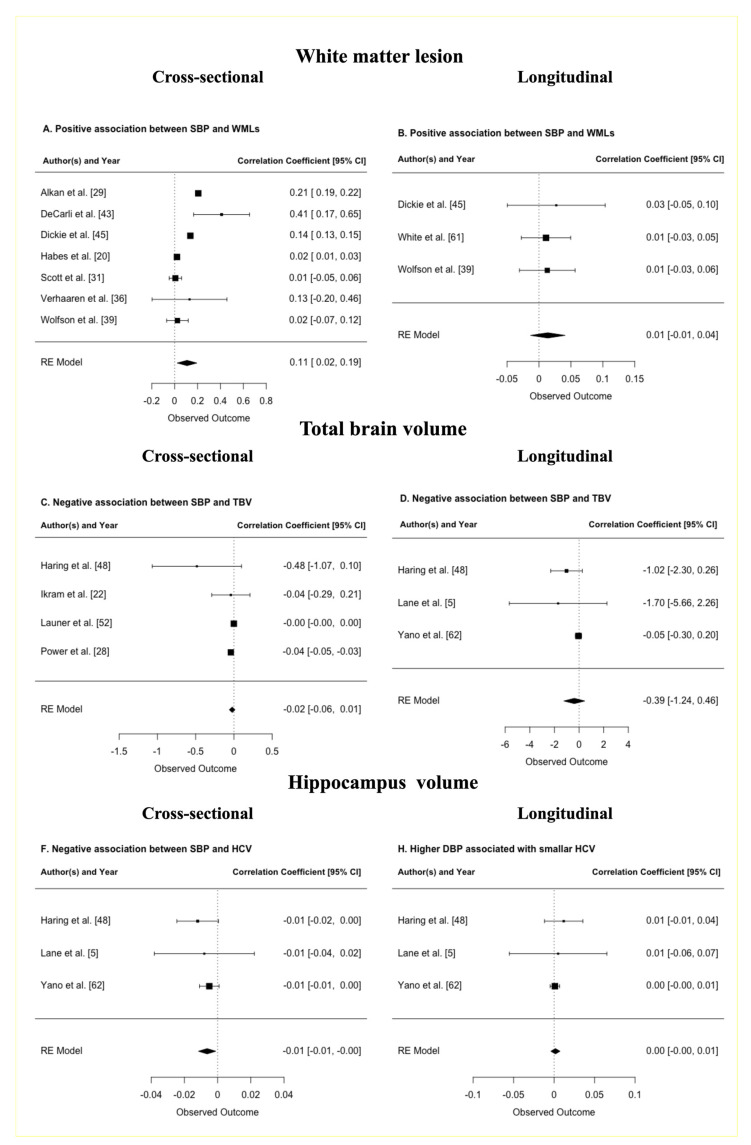
Figure 5.
Forest plots of analyses investigating the association between continuous systolic blood pressure (SBP) and brain volumes in cm3; (A) shows a positive association between SBP and white matter lesions (WMLs) in cross-sectional studies; (B) shows a positive association between SBP and WMLs in longitudinal studies; (C) shows a negative association between SBP and total brain volume (TBV) in cross-sectional studies; (D) shows a negative association between SBP and TBV in longitudinal studies; (E) shows a negative association between SBP and smaller hippocampus volume (HCV) in cross-sectional studies; and (F) shows a negative association between SBP and HCV in longitudinal studies. The effect size is a standardized beta-coefficients. The sizes of the squares reflect the weight given to each effect size.

