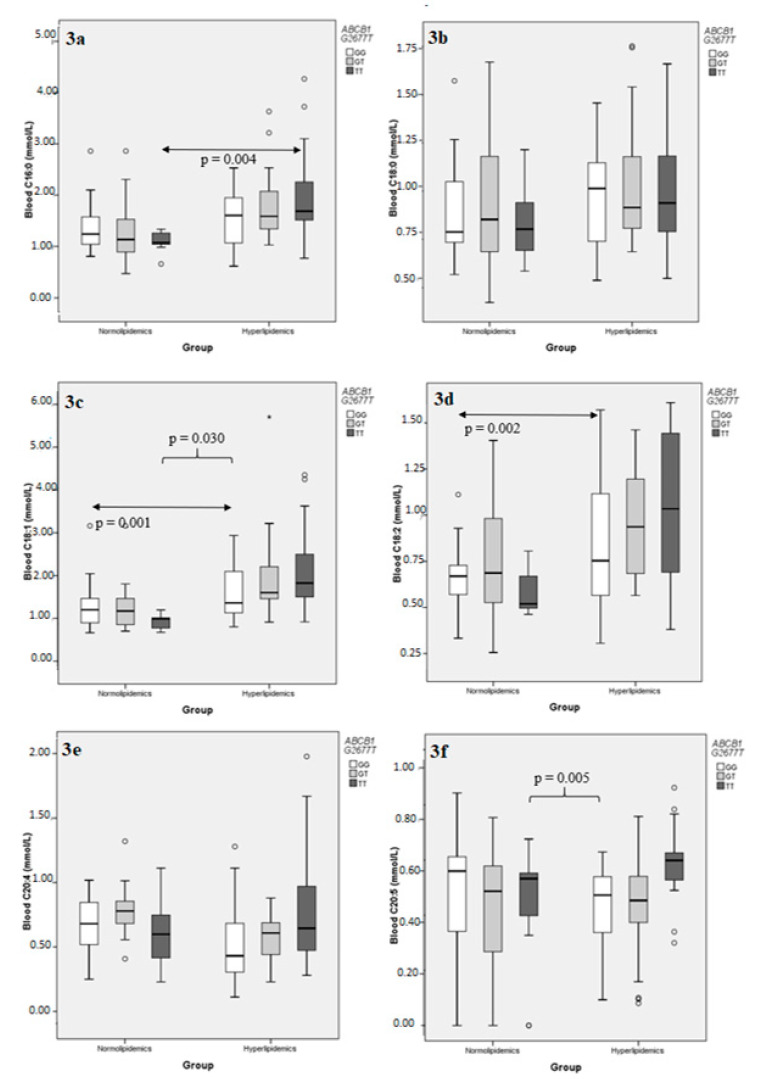
Figure 3.
Comparison of the distributions of individual blood fatty acid concentrations following stratification according to ABCB1 G2677T genotypes, in normolipidemic controls and hyperlipidemic patients. (a) C16:0; (b) C18:0; (c) C18:1; (d) C18:2; (e) C20:4; (f) C20:5. A small circle indicates an outlier, defined by SPSS as extending within 1.5 and 3 lengths of the interquartile range from the edge of the corresponding box. An asterisk indicates an extreme value, defined by SPSS as extending more than 3 lengths of the interquartile range from the edge of the box.

