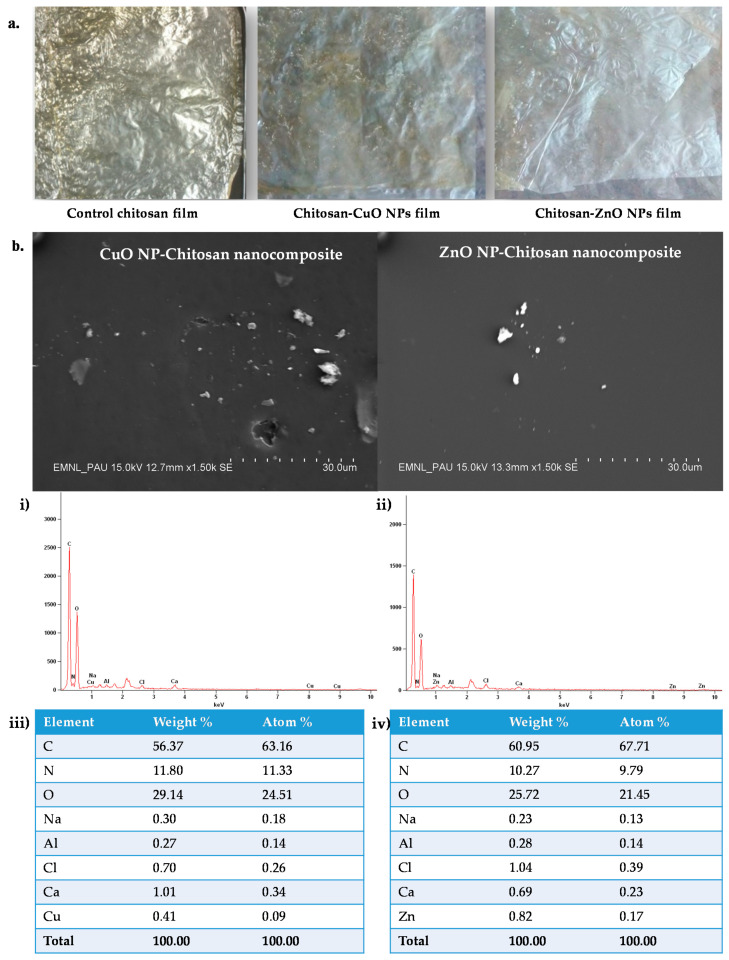
Figure 5.
Optical images and Scanning electron micrographs of the synthesized chitosan nanocomposite films. (a) Optical images of chitosan control and nanocomposite films; (b) SEM image depicting the film surface and SEM-EDS spectra of the CuO and ZnO-chitosan nanocomposite films; (i) EDS spectra of Chitosan-CuO NPs films, (iv) (ii) EDS spectra of Chitosan-ZnO NPs nanocomposite film, (iii) Table depicting EDS quantitative results for Chitosan-CuO NPs films, (iv) Table depicting EDS quantitative results for Chitosan-ZnO NPs films.

