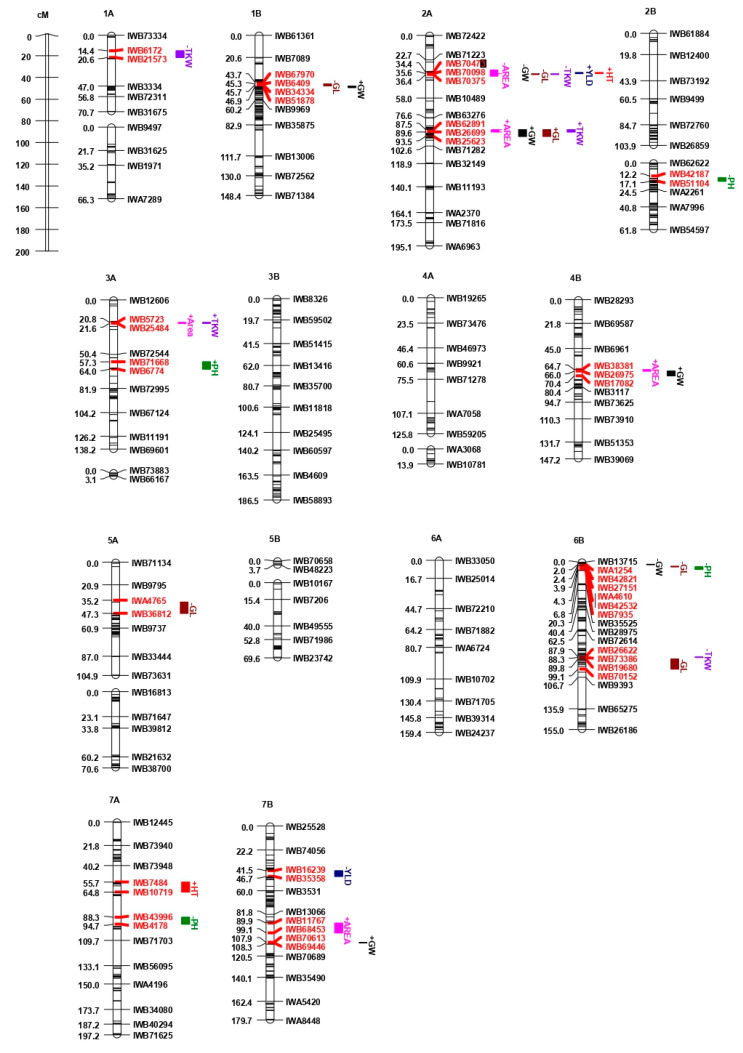
Figure 2.
Schematic representation of the durum linkage map Liberdur x Anco Marzio with map positions of QTL for grain yield (YLD), plant height (PH), heading time (HT), thousand kernel weight (TKW), grain length (GL), grain width (GW), grain area (AREA). Each chromosome map is represented by the first and the last SNP marker, and by a SNP marker every about 20 cM. Markers are indicated on the right side and cM distances on the left side of the bar. QTL are represented by bars on the right of each chromosome bar. The + or − preceding the QTL name indicate the positive or negative additive effect of the parental line Liberdur. The left and right SNP markers of the QTL interval are indicated in red.

