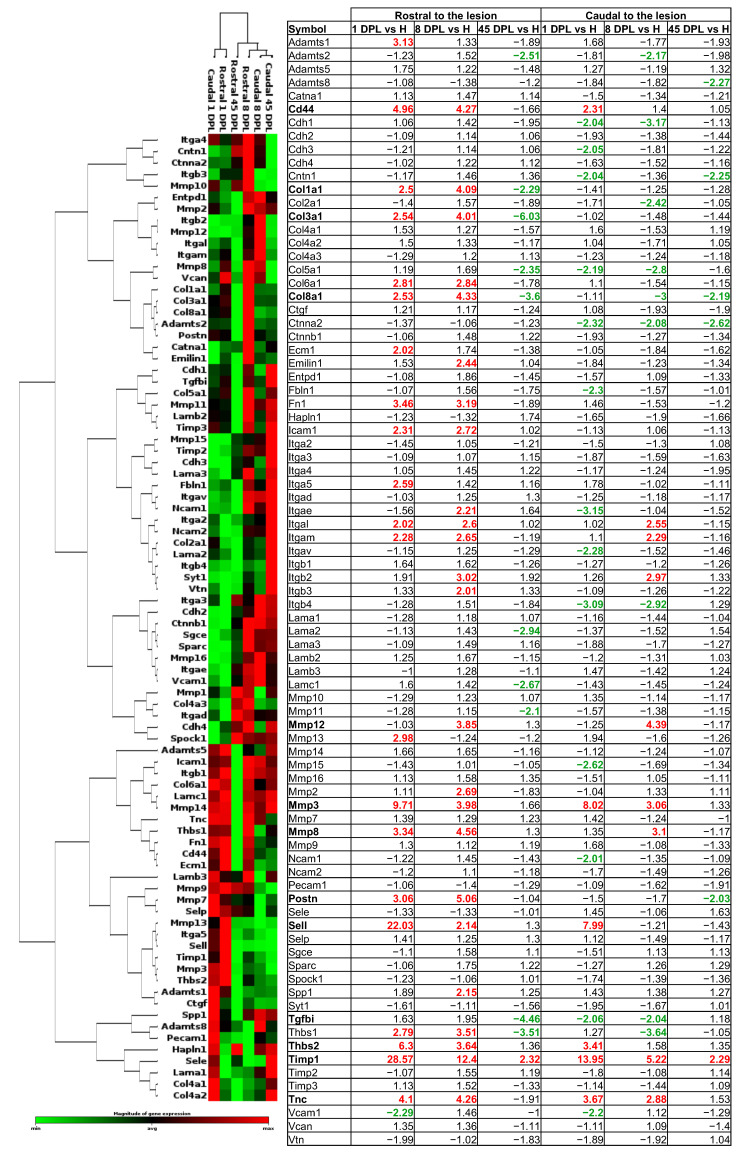
Figure 2.
Heat map of the cluster analysis of extracellular matrix (ECM) gene expression regulation. ECM gene mRNA expression in the rostral and caudal segments of the spinal cord at all time points are shown in the table as fold change compared to the pool of intact segments of spinal cord (n = 5 per group, pooled). The clustergram shows the co-regulated genes across the group, analyzed with a vertical dendrogram and the clusterization of the segments of spinal cord at each time point illustrated with a horizontal dendrogram. A red color indicates a higher expression with respect to the median of the gene, whereas a green color indicates a lower expression. Gene names in bold indicate the highly regulated genes (fold of change > 4).

