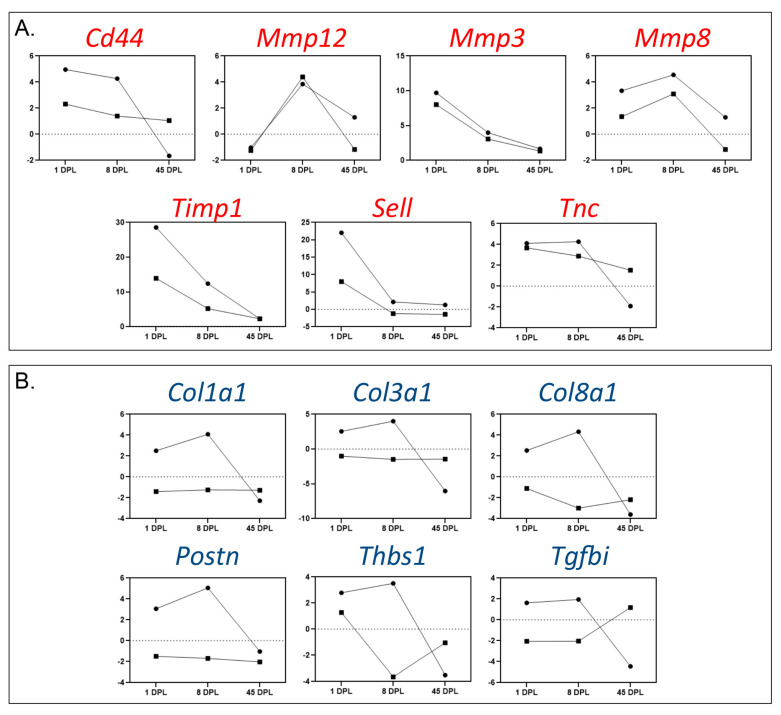
Figure 3.
Time-course changes in the mRNA expression level of highly regulated genes. The figure illustrates the data obtained from the Polymerase Chain Reaction (PCR) array of genes regulated more than 4 times in at least one of the two segments and at least one considered time point. Genes are divided into similarly (A) or differently (B) regulated in the rostral and caudal segments. Circles represent the segment rostral while squares the region caudal to the lesion.

