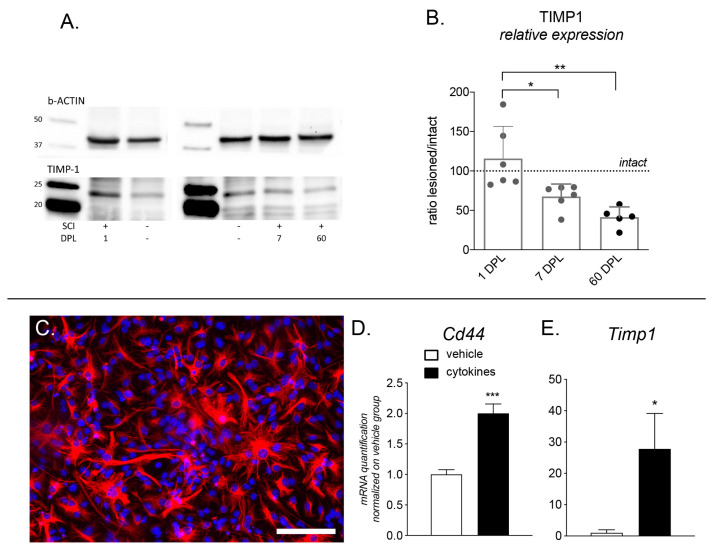
Figure 6.
Timp1 protein quantification in the spinal cord and expression of Cd44 and Timp1 in primary astrocyte cultures: (A) Two representative gels are shown in the figure. Upper panel shows b-Actin (43 kDa), used as house-keeping protein, lower panel shows Timp1 (23 kDa) in each analyzed group (intact animals: SCI-; lesioned: SCI+ at 1 DPL, 7 DPL and 60 DPL); (B) Graph shows relative Timp1 expression calculated as signals as measured by densitometry, indicated by relative intensity (lesioned versus controls). Statistical analysis: one-way ANOVA and Tukey post-hoc test, * p < 0.05; ** p < 0.001; (C) Micrograph illustrates pure astrocyte cultures stained for GFAP marker; (D,E) Graphs show mRNA expression level of Cd44 (D) and Timp1 isoform b (E) in cultures exposed to vehicle or cytokine mix for 48 h. Statistical analysis. Student’s t-test. Asterisk represents difference between vehicle- and cytokine- treated groups (* p > 0.05).

