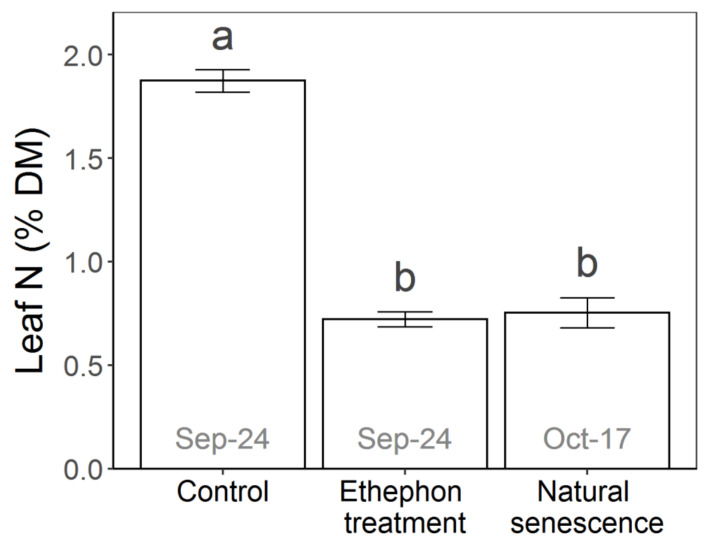
Figure 6.
Mean total N concentration ± standard deviation in leaves of control, ethephon-treated and naturally senescing Vitis vinifera cv. Riesling vines. Leaves were sampled on two different dates as stated at the bars, at complete yellowing of the ethephon-treated (control and ethephon treatment) and at complete yellowing of the naturally senescing leaves. Experimental treatments with different letters on top differ significantly with p < 0.05.

