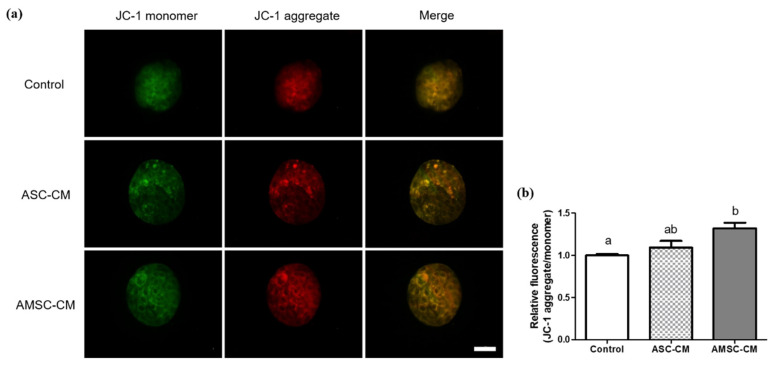
Figure 8.
Assessment of mitochondrial membrane potential in blastocysts (BL) cultured with human adipose-derived mesenchymal stem cell conditioned medium (ASC-CM) and amniotic membrane-derived mesenchymal stem cell conditioned medium (AMSC-CM). (a) Representative fluorescent images of JC-1 monomer (green) and aggregate (red) stained BL. Original magnification 400×. Scale bar = 50 μm. (b) The ratio of JC-1 aggregate (red) to JC-1 monomer (green) presented by quantifying fluorescence intensity of JC-1 mitochondrial membrane potentials in BL. Data are expressed as the mean ± standard error of the mean (SEM). Superscript letters in each column indicate significant differences (p < 0.05).

