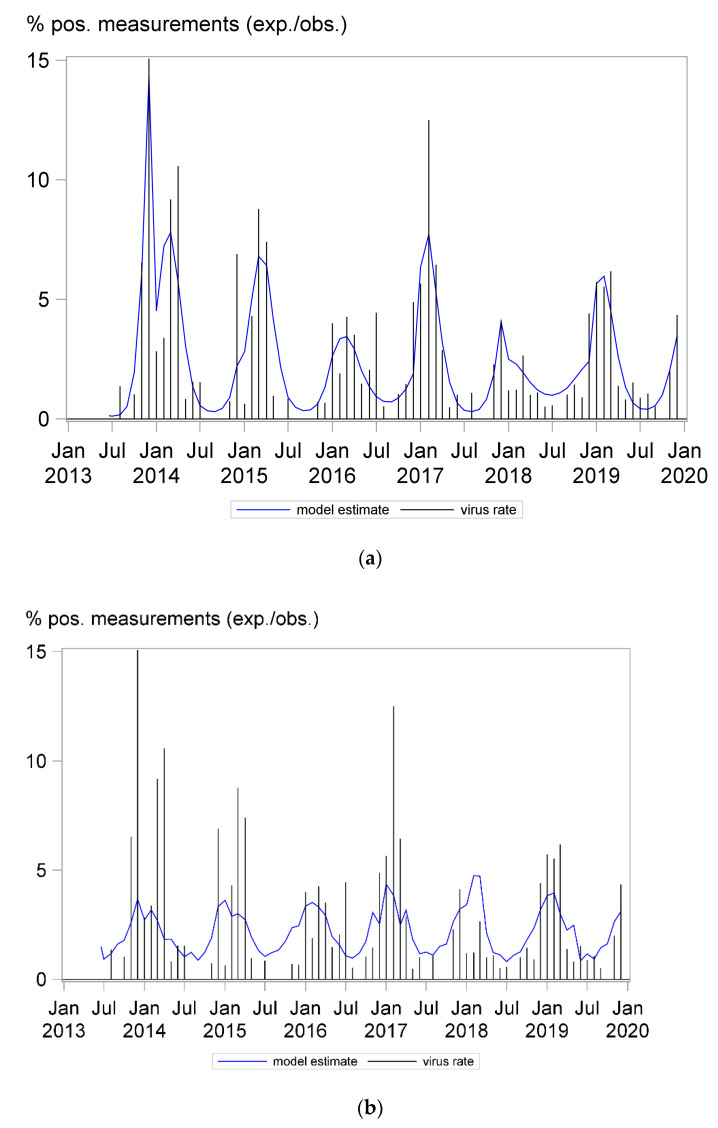
Figure 1.
Coronavirus infections followed a seasonal pattern. The needles in the A and B panels show the monthly detection rate. The curves in panels A and B depict the models describing a seasonality effect (a) and a combined effect of seven weather factors (daily average ambient temperature, relative humidity, wind speed, cloud cover, atmospheric pressure, precipitation and number of sunlight hours) (b) on coronavirus detection rate, respectively. Both models had an adequate fit; however, a better model fit was obtained using seasonality to predict virus detection rates.

