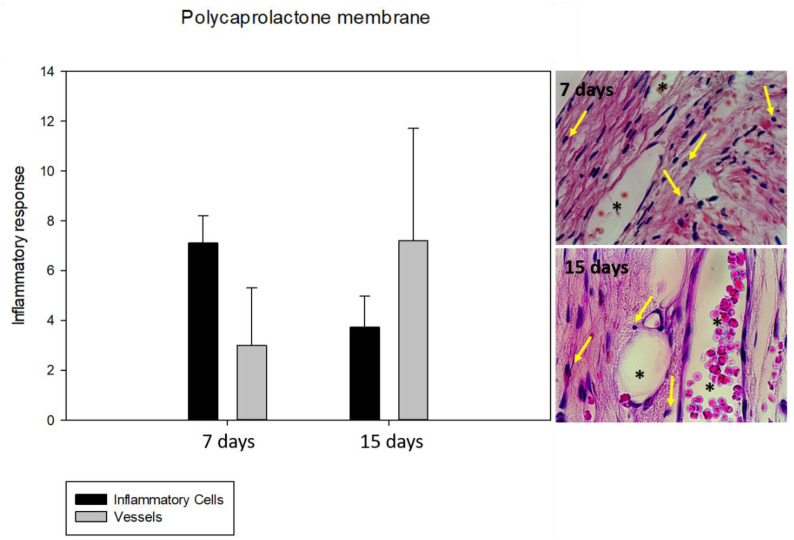
Figure 3.
Graph and photomicrographs (×100) demonstrating the average number of inflammatory cells and vessels in the BG group during the periods analyzed. Regarding the biological behavior of the polycaprolactone membrane, there was a decrease in the number of inflammatory cells and an increase in the number of vessels. * indicates blood vessel.

