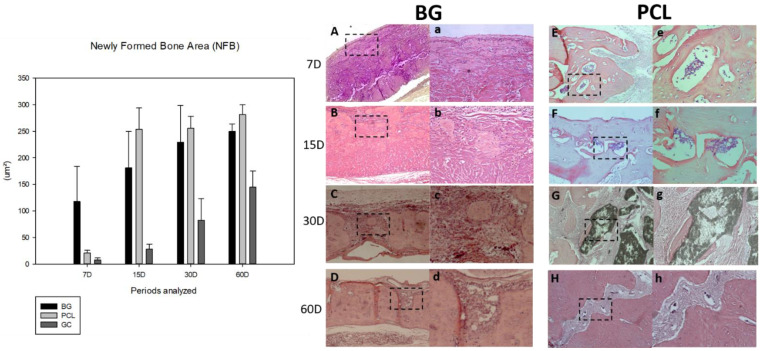
Figure 4.
Graph and representative photomicrographs comparing the areas of bone neoformation between the groups and periods analyzed. Comparing the membranes used, there was no statistically significant difference between the PCL and BG groups (p = 0.799). The factor time, mainly at the initial periods, is critical for better results. For the BG group at 7 (A), 15 (B), 30 (C), and 60 (D) days (×12.5): (A) Panoramic image of newly formed bone near the periosteum. (B) Panoramic image of osteoid tissue islands at the center of the defect. (C) Panoramic image of the center of the defect almost closed with immature bone tissue. (D) Panoramic image of the center of the defect. (a–d) are higher magnifications (×25) of the panoramic views. For the PCL group (×12.5): (E) Panoramic image of the osteoid tissue around a polycaprolactone particle near the stump. (F) Panoramic image of the osteoid tissue around a polycaprolactone particle near the center of the defect. (G) Panoramic image of a large polycaprolactone particle with mature osteoid tissue. (H) Panoramic image of the center of the defect with a remaining particle of polycaprolactone. (e–h) are higher magnifications (×25) of the panoramic views. In short, PCL = BG > CG.

