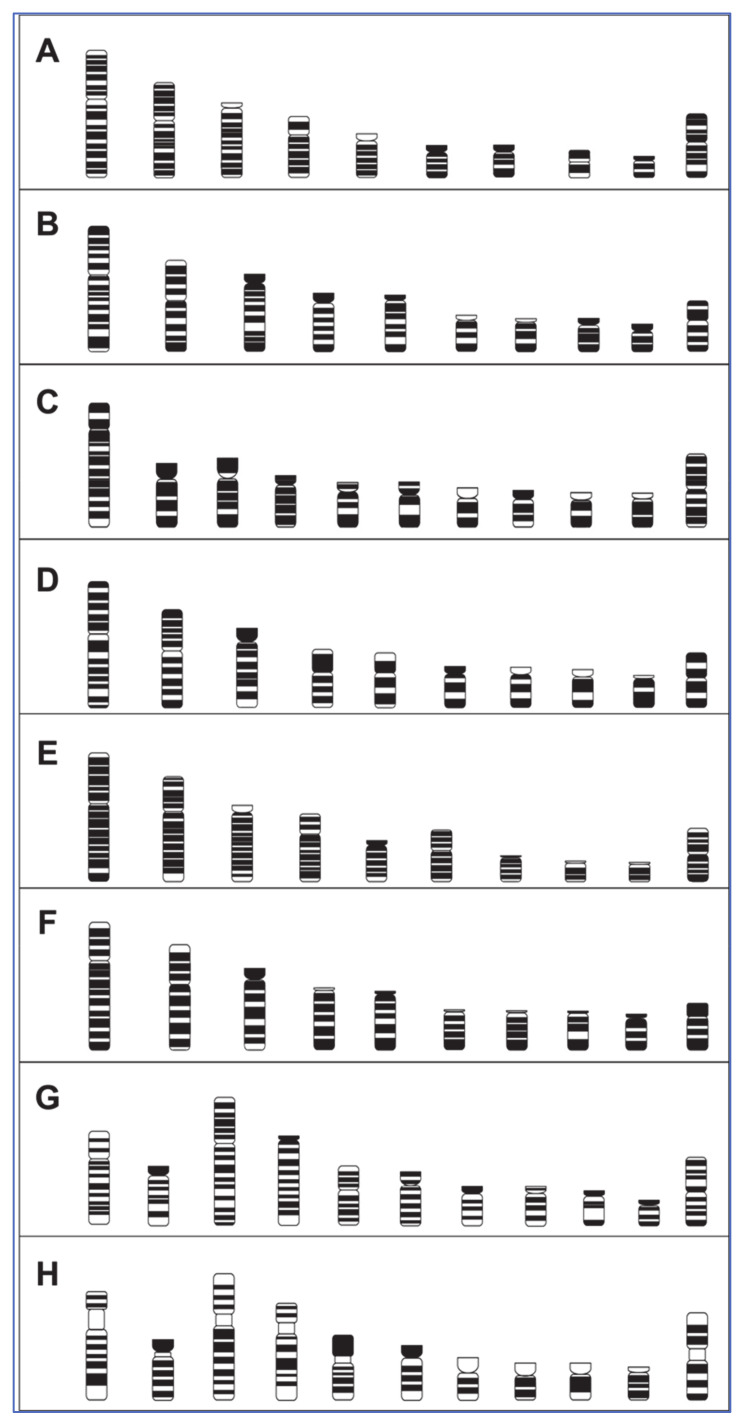
Figure 3.
Ideograms of the macrochromosomes from all of the seven avian species compared to chicken. (A) chicken (Gallus gallus), (B) mallard duck (Anas platyrhynchos), (C) Eurasian woodcock (Scolopax rusticola), (D) rock dove/pigeon (Columba livia), (E) helmeted guinea fowl (Numida meleagris), (F) houbara bustard (Chlamydotis undulata), (G) common blackbird (Turdus merula), (H) Atlantic canary (Serinus canaria). Scale bar 5 μm.

